
Figure 4.
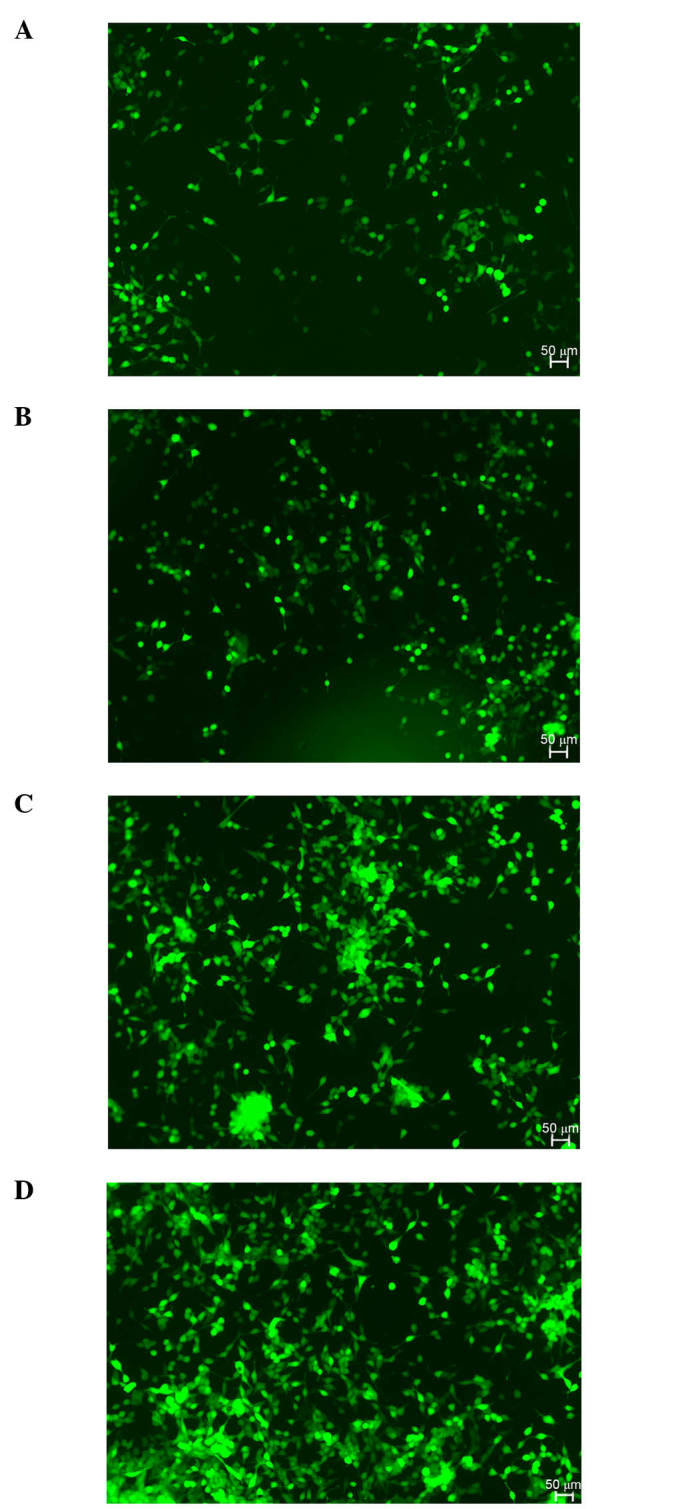
LNCaP cell proliferation 24 and 72 h post-transfection, demonstrated using green fluorescence microscopy. The images illustrate LNCaP cell growth status 24 h subsequent to the (A) LV-Cas9-sgRNA-AR230 and (B) LV-Cas9-control virus transfection; and LNCaP cell growth status 72 h following the (C) LV-Cas9-sgRNA-AR230 and (D) LV-Cas9-control virus transfection. sgRNA, single-guide RNA.