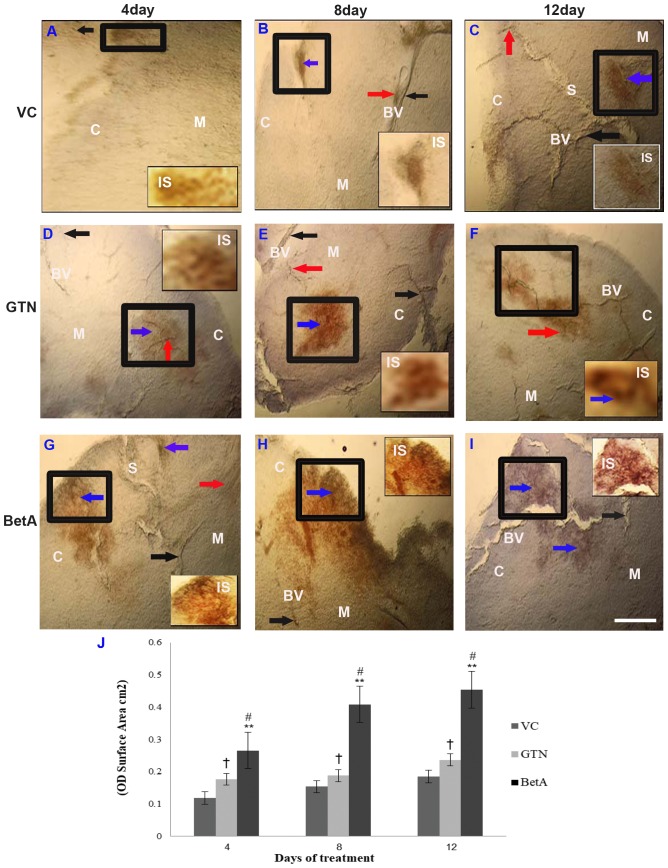
Figure 2.
Representative photomicrographs demonstrating thymus sections of the (A-C) VC (dimethyl sulfoxide), (D-F) positive (GTN) and (G-I) BetA-treated groups on days 4, 8 and 12 after treatment. Inset (IS) is representative of the area in the figure outlined in black. Black arrows identify the NADPH-d-stained blood vessels (BV), the red arrow points the perivascular nerve fibres and blue arrow demonstrates the NADPH-d positive cells in the cortex (denoted by the letter C) and medulla (denoted by the letter M). The letter ‘S’ indicates the interlobular septum. Scale bar, 100 µm. (J) The intensity (OD) of the NADPH-d staining was quantified using Olympus Soft Imaging cellSens software version 1.6. Data are expressed as means ± standard deviation of mice (n=6 per group) **P<0.001 vs. the VC group, #P<0.001 vs. the GTN group. †P<0.01 vs. the VC group. GTN, goniothalamin; BetA, betulinic acid; NADPH-d, nicotinamide adenine dinucleotide phosphate diaphorase; VC, vehicle control; OD, optical density.

