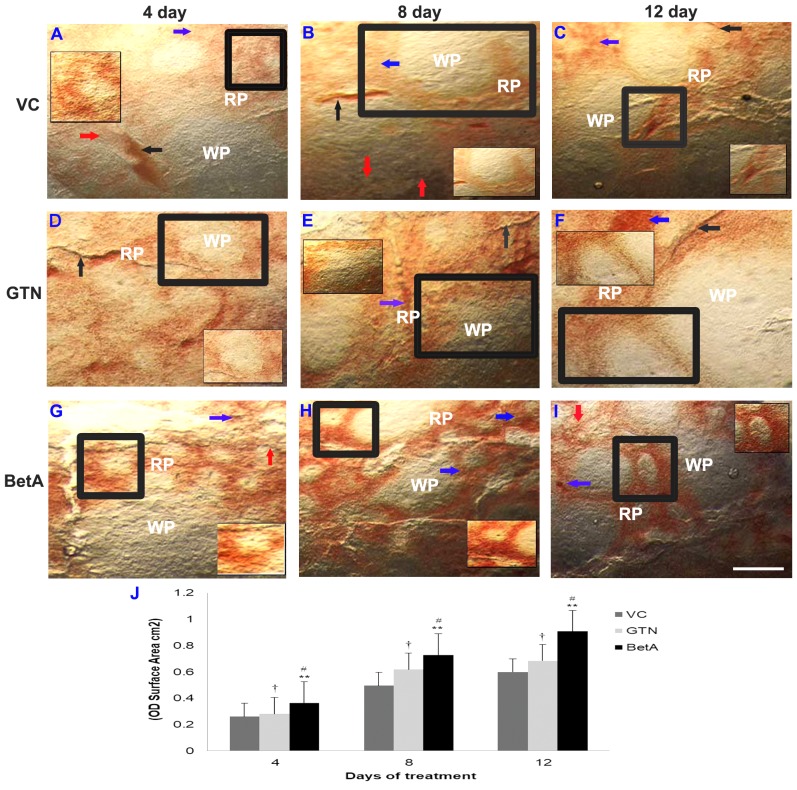
Figure 3.
Representative photomicrographs demonstrating spleen sections the (A-C) VC (dimethyl sulfoxide), (D-F) positive (GTN) and (G-I) BetA-treated groups on days 4, 8 and 12 after treatment. Inset (IS) is representative of the area in the figure outlined in black. Black arrows identify the NADPH-d-stained blood vessels (BV), the red arrow points the perivascular nerve fibres and blue arrow demonstrates the NADPH-d positive cells in the red pulp (RP) region. ‘WP’ indicates the white pulp region. Scale bar, 100 µm. (J) The intensity (OD) of the NADPH-d staining was quantified using Olympus Soft Imaging cellSens software version 1.6. Data are expressed as means ± standard deviation of mice (n=6 per group) **P<0.001 vs. the VC group, #P<0.001 vs. the GTN group, †P<0.01 vs. the VC group. GTN, goniothalamin; BetA, betulinic acid; NADPH-d, nicotinamide adenine dinucleotide phosphate diaphorase; VC, vehicle control; OD, optical density.

