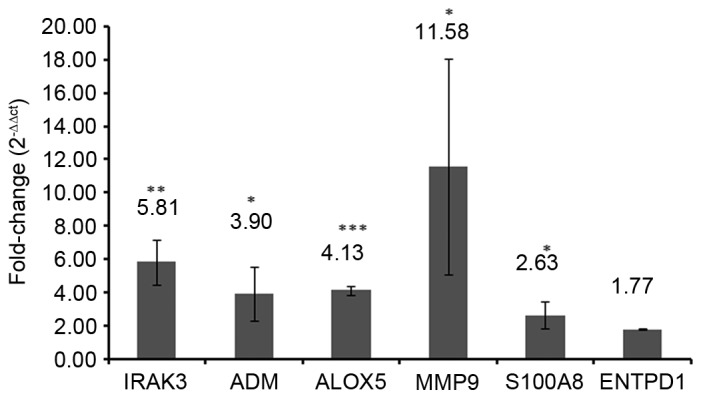
Figure 8.

Expression levels of selected differentially expressed genes. Results are presented as fold change (2−ΔΔcq; patient/control) values; 2−ΔΔcq >1 indicates an upregulated gene and 2−ΔΔcq <1 indicates a downregulated gene. IRAK3, interleukin 1 receptor-associated kinase 3; ADM, adrenomedullin; ALOX5, arachidonate 5-lipoxygenase; MMP9, matrix metallopeptidase 9; S100A8, S100 calcium-binding protein A8; ENTPD1, ectonucleoside triphosphate diphosphohydrolase 1.
