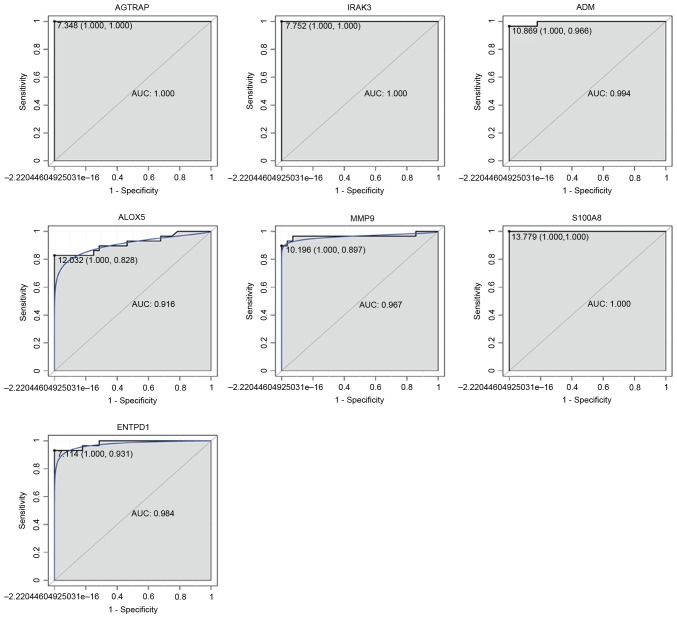
Figure 9.
ROC curves of selected DEGs between patients with sepsis and healthy controls. The ROC curves were utilized to indicate the diagnostic ability of these selected DEGs with 1-Specificity (the proportion of false positive results; x-axis) and sensitivity (the proportion of true positive results; y-axis). ROC, receiver operating curve; DEG, differentially expressed gene; AGTRAP, angiotensin II receptor-associated protein; IRAK3, interleukin 1 receptor-associated kinase 3; ADM, adrenomedullin; ALOX5, arachidonate 5-lipoxygenase; MMP9, matrix metallopeptidase 9; S100A8, S100 calcium-binding protein A8; ENTPD1, ectonucleoside triphosphate diphosphohydrolase 1; AUC, area under the curve.

