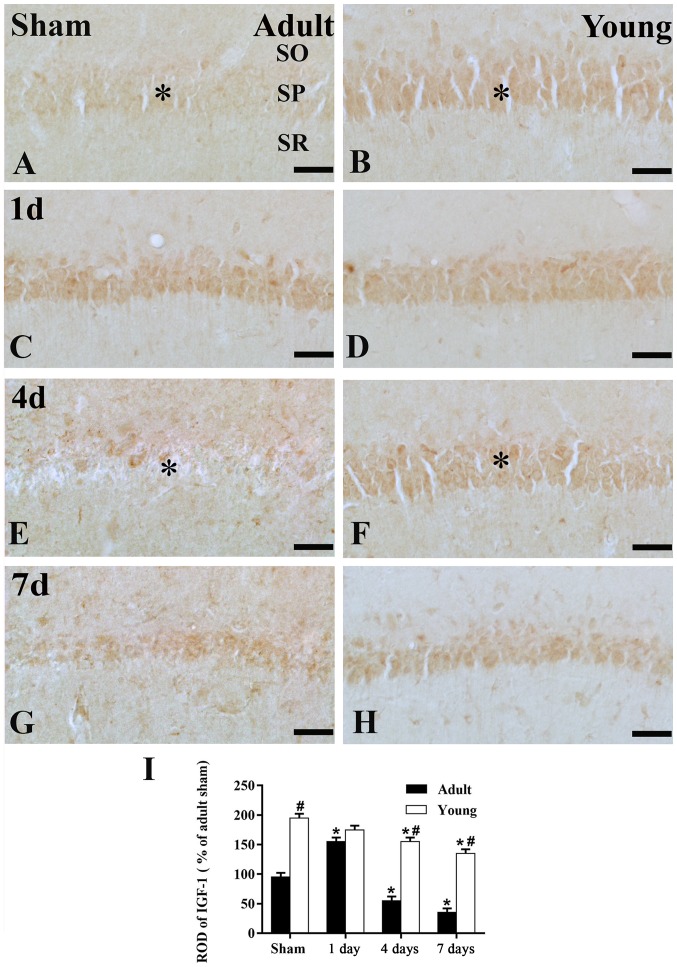
Figure 3.
Immunohistochemistry for IGF-1 in the adult and young of the (A and B) sham- and the ischemia groups: (C and D) 1 day, (E and F) 4 days and (G and H) 7 days. Scale bar=50 µm. (I) ROD as a percentage of the IGF-1 immunoreactivity. Data are presented as the mean ± standard error of the mean (n=7 per group). The * on each image indicates the expression of IGF-1 or the IGF-1 receptor in the SP. *P<0.05 vs. the sham group; #P<0.05, vs. the respectively preceding group. IGF-1, insulin-like growth factor 1; SO, stratum oriens; SP, stratum pyramidale; SR, stratum radiatum; ROD, relative optical density.

