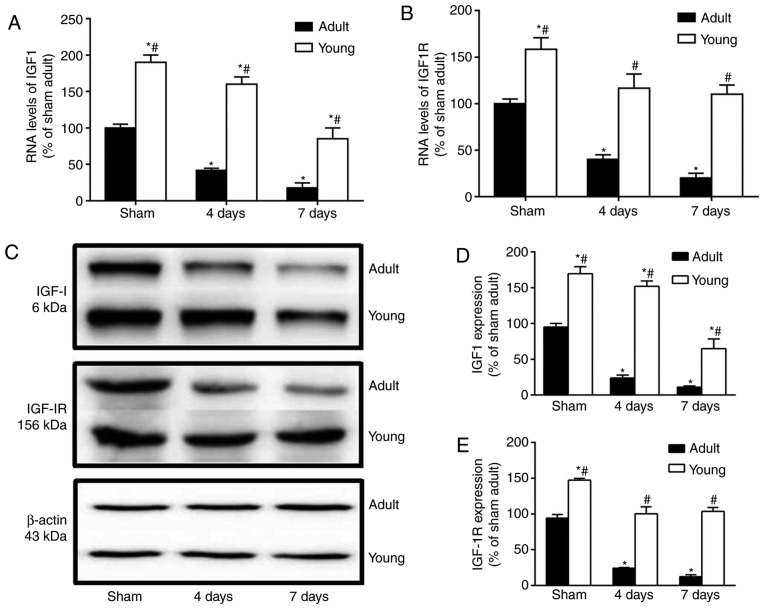
Figure 6.
Western blot analysis and reverse transcription-quantitative polymerase chain reaction of IGF-1 and IGF-1R in the CA1 of the young and adult groups (n=7/group) following ischemia-reperfusion. The RNA levels of (A) IGF-1 and (B) IGF-1R in the hippocampal CA1 region of gerbils. (C) The protein levels of (D) IGF-1 and (E) IGF-1R in the in the hippocampal CA1 region of gerbils. ROD as a percentage of the immunoblot band is presented. Data are presented as the mean ± standard deviation (n=7/group) *P<0.05 vs. the sham group; #P<0.05, vs. the corresponding adult group. IGF-1, insulin-like growth factor 1; IGF-1R, insulin-like growth factor 1 receptor; ROD, relative optical density.

