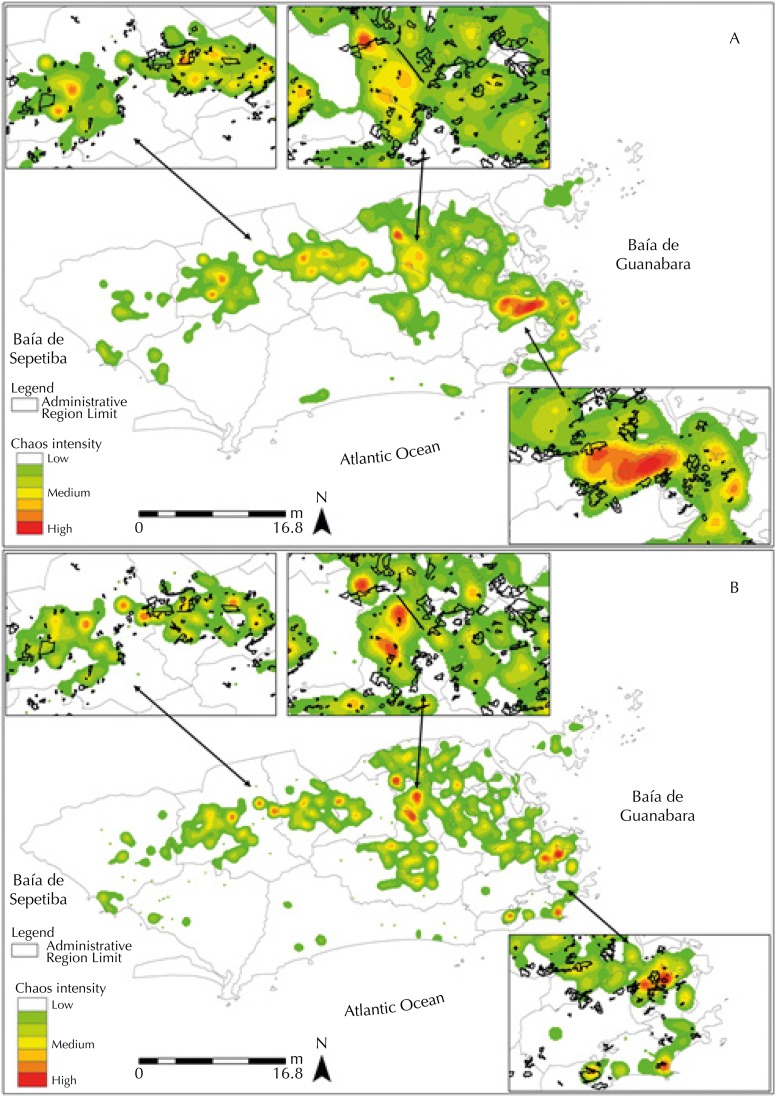
Figure 1. Kernel density of laboratory confirmed CD (A) and SD (B) cases in the city of Rio de Janeiro in the years 2011–2012.
Note: The rectangles highlighted in the figures are intended to expand areas that have high Kernel density. Localization information of the subnormal clusters was included in the highlighted rectangles, identified by black traces.
CD: classical dengue; SD: severe dengue

