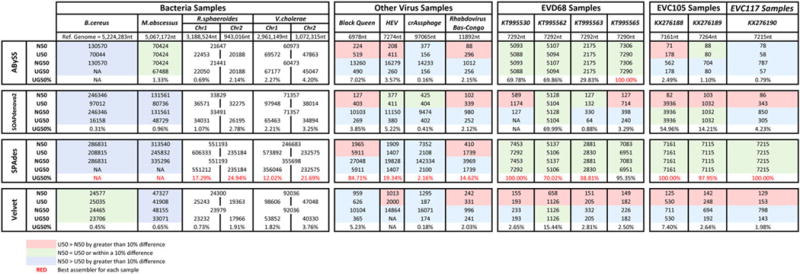
FIG. 3.

Comparison of the N50, U50, NG50, UG50, and UG50% for different bacterial and viral datasets using four different assemblers. Contigs for the bacteria dataset were retrievedfrom Magoc et al. (2013), whereas all other contigs were generated in-house. All datasets were sequenced by using the Illumina MiSeq.
