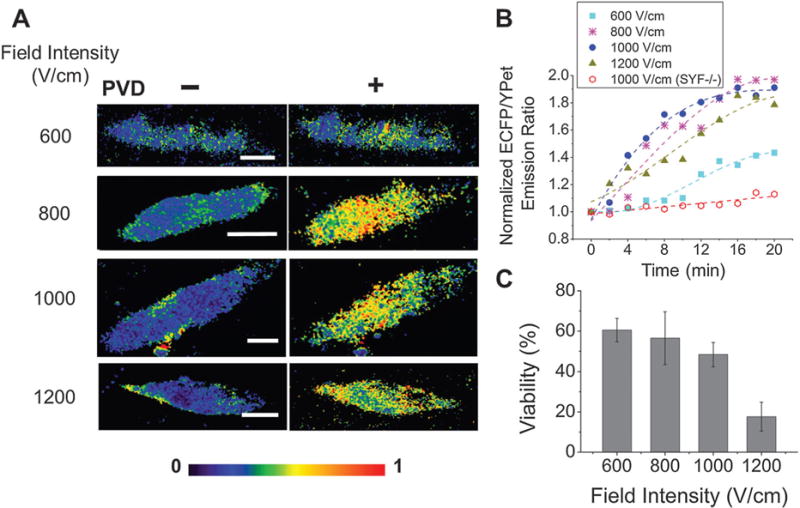
Fig. 3.

The signal from the Src biosensor under various pulse intensities. (A) Color-coded images of ECFP/YPet emission ratios before and 20 min after PVD stimulation. (B) Temporal dynamics of the normalized emission ratio of ECFP/YPet upon PVD stimulation at t = 0. Trend lines (broken lines) are added to guide the eye. (C) The dependence of the cell viability on the field intensities. The Src biosensor was delivered into MEF cells by electroporation under the field intensities of 600, 800, 1000 and 1200 V cm−1 in (A), (B) and (C), and into SYF−/− cells by 1000 V cm−1 in (B). The pulse duration was 15 ms (scale bars, 10 μm).
