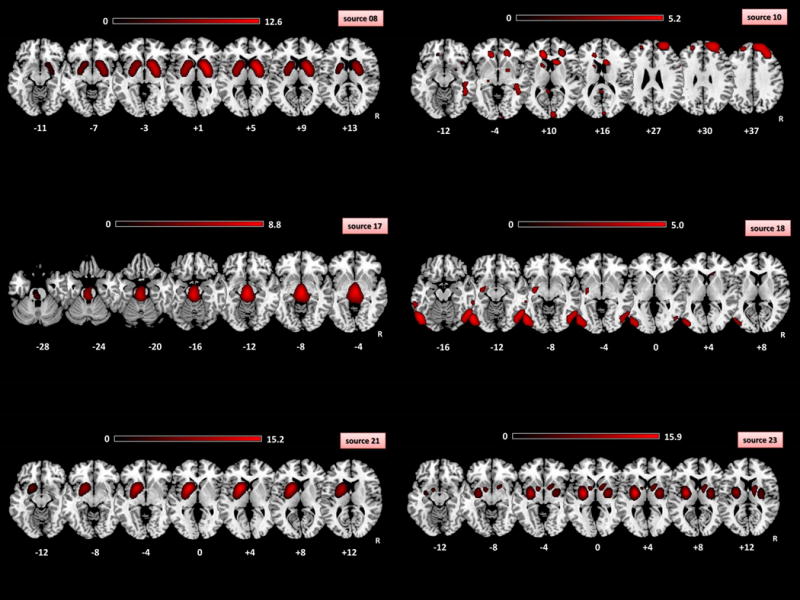
Figure 2. 123I-FP-CIT (DaTscan®) imaging alterations in PD compared to CG with SBM approach.

Each sources represented the absolute spatial pattern of the non-artifactual 123I-FP-CIT binding derived from ICA analysis. Source 8: caudate and lentiform nuclei, insula anterior cingulate gyri; Source 10: bilateral inferior, middle, superior frontal gyri, right middle temporal and occipital gyri, caudate and lentiform nuclei, cingulate gyri; Source 17: pons, midbrain, bilateral posterior cingulate, thalami; Source 18: bilateral middle occipital, fusiform, inferior temporal, middle temporal, inferior occipital gyri; Source 21: left putamen, left caudate and left insula; Source 23: lentiform nuclei, caudate, insula, pons, right medial frontal gyrus and left inferior temporal gyrus. See Table 2 for details about the components significantly different between PD and CG. All the spatial components were thresholded at Z=3.0. Spatial patterns were superimposed on a standardized MRI T1 3D template. R: right. Montreal Neurological Institute of standardized space are shown below of each slices. R: right. PD: Parkinson’s Disease. CG: control group. SBM: source-based morphometry.
