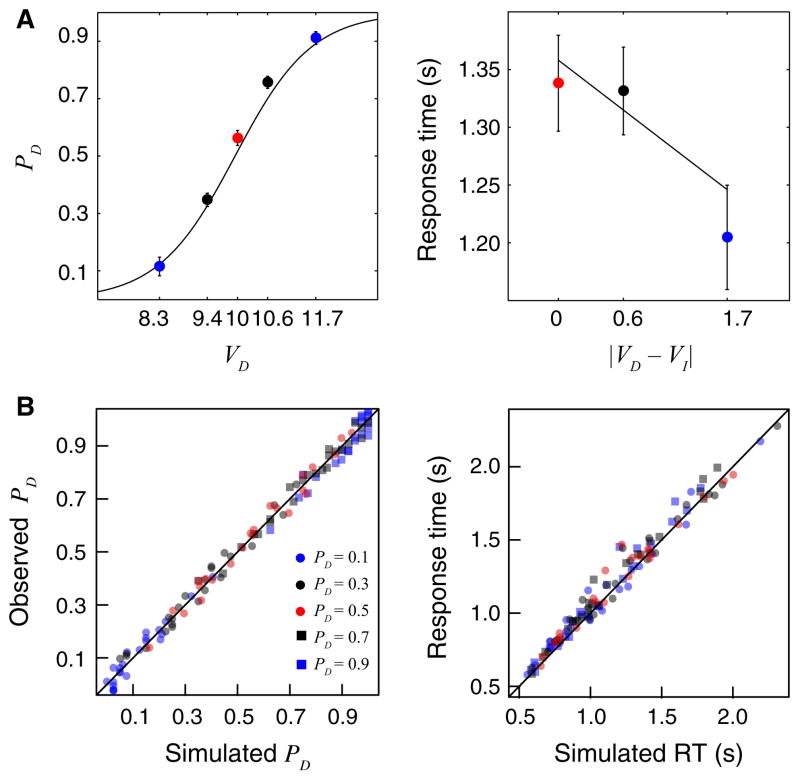
Fig. 3.
Behavioral results. (A) Left: observed choice probabilities closely matched the targeted choice probabilities. Right: RTs were slowest at indifference and decreased as a function of relative value evidence (|VD−VI|). Both plots show the data as solid dots that are color-coded by levels of relative value evidence. The solid lines correspond to the best-fitting mixed-effects regressions reported in the text. (B) Single-trial model parameters recover choice probabilities and median RT. Left: simulated and observed choice probabilities of the delayed reward for each of the five task conditions, labeled by their expected PD and color-coded by |VD−VI| levels. Jitter was added to the plotted data to better reflect the total number of observations. Right: medians of the simulated and observed RTs, using the same color labels as on the left panel.

