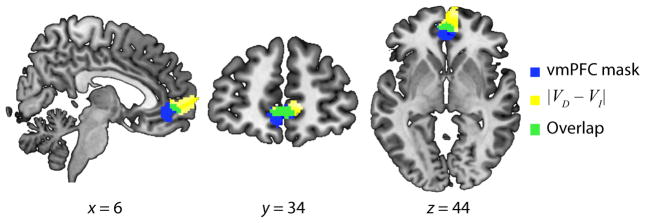
Fig. 4.
Value encoding in the vmPFC. Yellow, vmPFC region ([6, 62, 0], k = 356 voxels) in which neural activity correlated with |VD−VI| during the decision period; blue, vmPFC mask from a published meta-analysis of value-encoding studies (k = 448 voxels); green, overlap between vmPFC regions shown in yellow and blue (k = 67 voxels). The |VD−VI| contrast was thresholded at P < 0.005 at the voxel level (k > 290 voxels) and overlaid on the CH2 Montreal Neurological Institute anatomical image, shown in neurological convention with the right hemisphere on the right side.

