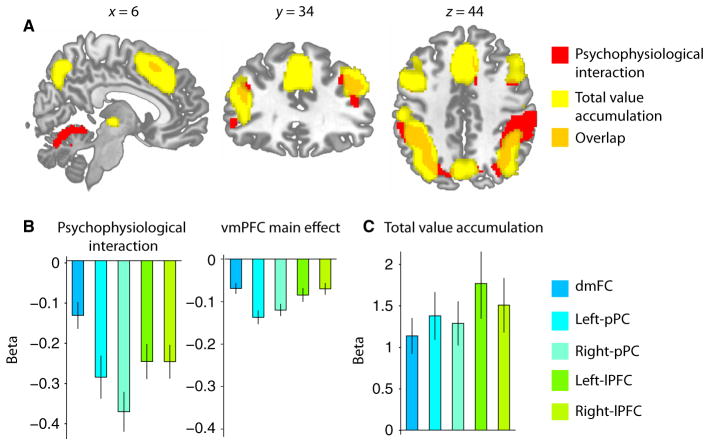
Fig. 5.
Functional connectivity with the vmPFC and value accumulation. (A) Red, regions showing evidence of increased connectivity with the vmPFC during the decision period; yellow, regions whose activity correlates with trial-to-trial variability in the TVA regressor derived from the LBA model; orange, overlap of regions shown in red and yellow. In particular, frontoparietal regions including the dmFC (k = 146 voxels), bilateral pPC (left, k = 1259 voxels; right, k = 987 voxels) and bilateral lPFC (left, k = 539 voxels; right, k = 790 voxels) show considerable overlap between the two contrasts. These five overlapping regions were used as ROIs for all remaining analyses. (B) Average beta coefficients from the TVA GLM. No differences between frontoparietal regions are evident in the strength of the TVA effect. (C) Average beta coefficients from the PPI GLM analysis seeded in the vmPFC. Left: beta coefficients for the interaction term. Right: beta coefficients from the vmPFC ROI main effect term. There are significant negative correlations between the vmPFC and all frontoparietal regions (right), and an increase in the strength of the correlation during the decision period (left). Bilateral pPC regions show the strongest evidence of functional connectivity with the vmPFC. Error bars represent the SEM in (B) and (C).

