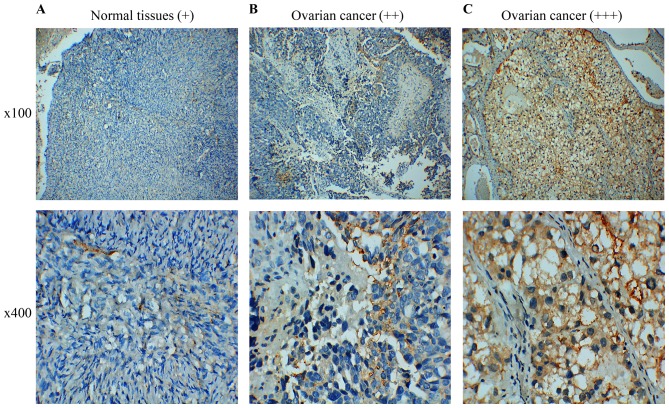
Figure 2.
Immunohistochemical staining pattern of FPR2 in EOC and control tissues. (A) FPR2 expression was not clearly observed in the normal ovarian tissues, and was scored as weak expression (+). (B) FPR2 was moderately expressed on the cytomembrane and cytoplasm of EOC cells (++). (C) FPR2 was strongly expressed on the cytomembrane and cytoplasm of EOC cells (+++).

