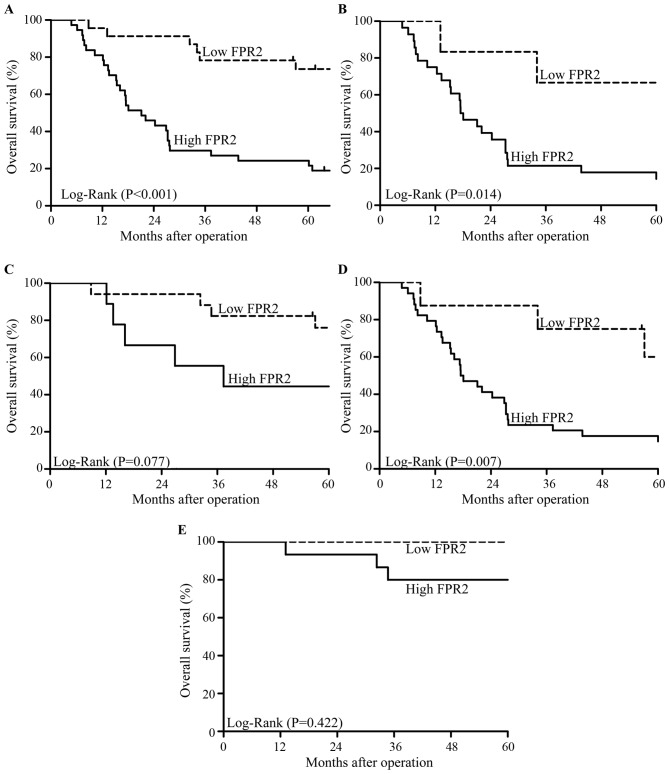
Figure 3.
Overall survival (OS) of EOC patients were analyzed using the Kaplan-Meier test. (A) Patients with high FPR2 expression showed a significantly lower OS compared with patients with low FPR2 expression (P<0.001). (B). In high-grade EOC patients, high FPR2 expression was associated with significantly lower OS compared with low FPR2 expression (P=0.014). (C) In low-grade EOC patients, high FPR2 expression showed no significant difference from low FPR2 expression in terms of the OS of EOC patients (P=0.077). (D) In advanced FIGO stages, high FPR2 expression indicated significantly lower OS compared with low FPR2 expression (P=0.007). (E) In early FIGO stages, high FPR2 expression showed no significant difference from low FPR2 expression in terms of the OS of EOC patients (P=0.422).

