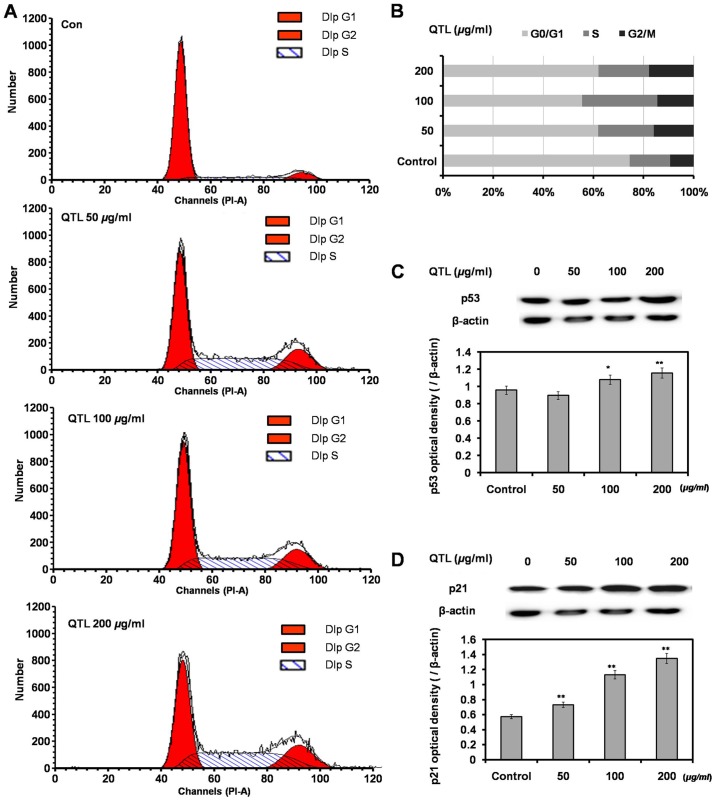
Figure 2.
Cell cycle analysis. Cells exposed to QTL (50, 100 and 200 µg/ml) for 48 h, and collected for analysis using flow cytometry revealing (A) the cell cycle state, (B) the cell cycle distribution and (C and D) western blotting. Each bar represents the mean ± SD referred to the corresponding β-actin values (n=3); *P<0.05 and **P<0.01 compared to the control. QTL, quercetrin from T. sinensis leaves.

