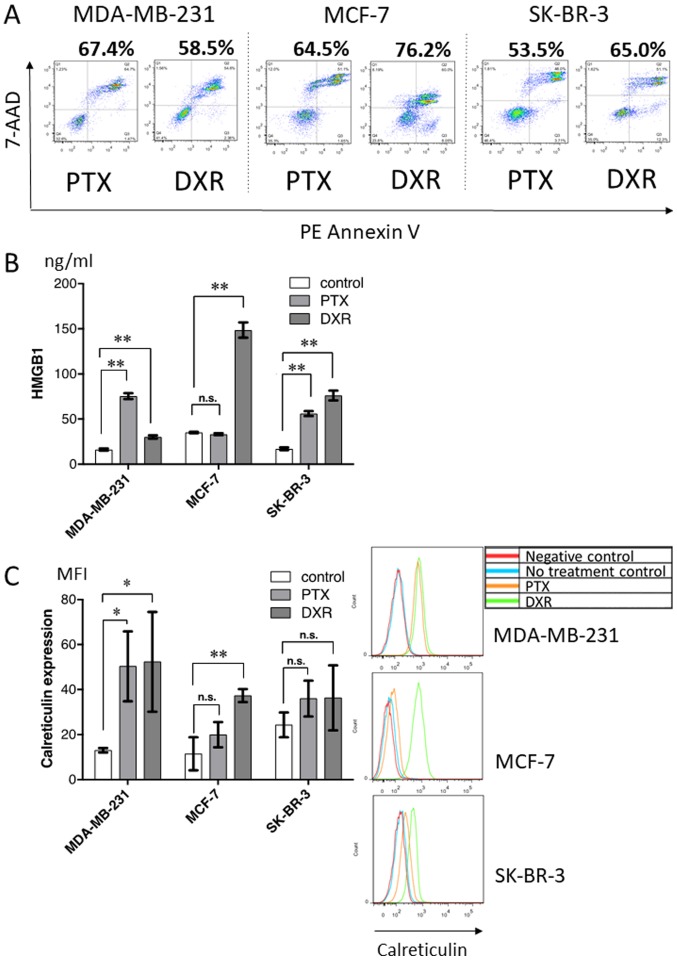
Figure 6.
In vitro treatment of breast cancer cell lines with chemotherapeutic drugs. (A) The proportion of dying cells [Annexin V(+) or 7-AAD(+)] was analyzed by flow cytometry. (B) HMGB1 in the supernatant after chemotherapy was evaluated by ELISA. (C) Calreticulin expressed on the cell surface after chemotherapy was evaluated by flow cytometry. Representative histograms for these cell lines are shown. *p<0.05, **p<0.001. PTX, paclitaxel; DXR, doxorubicin; HMGB1, high-mobility group box 1 protein. n.s., not significant.

