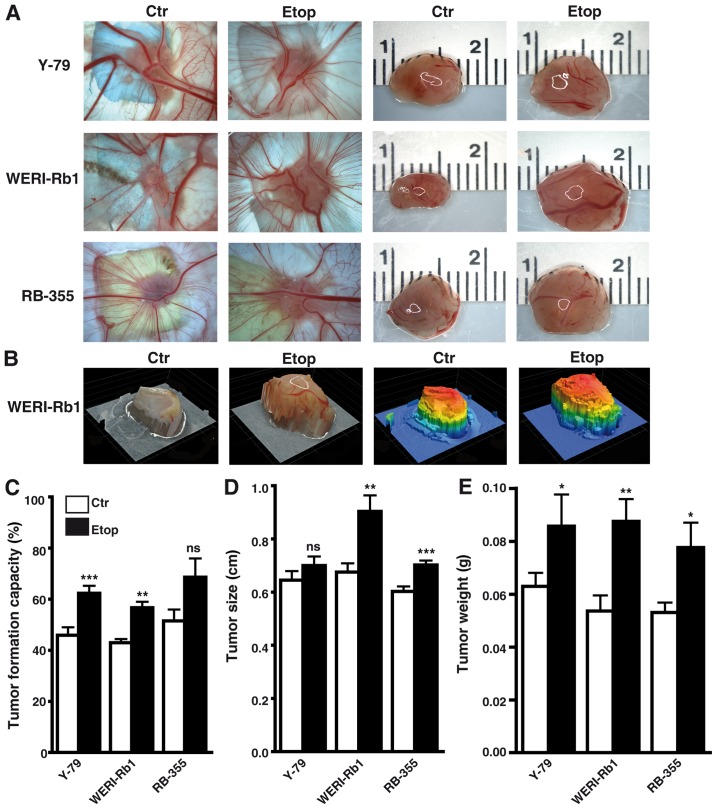
Figure 5.
Effects of etoposide resistance on tumor formation capacity of different RB cell lines. (A) Images of tumors in situ (left double column) and of ruler measurements (in cm) of excised tumors (right double column) revealed that tumors developing in the upper CAM from grafted etoposide-resistant RB cells (Etop) were significantly larger compared to those arising from control cells (Ctr). (B) Exemplary profiles of excised tumors forming from WERI-RB1 control (Ctr) and etoposide-resistant (Etop) cells visualizing 3-D tumor volume (left double column, natural as excised; right double column, stained by software to indicate different heights). (C) Quantification of tumor formation capacity (D), tumor size (E) and tumor weight (D) revealed that compared to control (Ctr) RB cells at least two out of three etoposide-resistant (Etop) RB cell lines analyzed formed significantly more, bigger and heavier tumors. Legend in C (also applies for D and E): white bars, control cells; black bars, etoposide-resistant cells. Values are means from at least 3 independent experiments ± SEM; *P<0.05, **P<0.01, ***P<0.001; ns, no statistical differences statistical differences compared to the control group calculated by Student's t-test.

