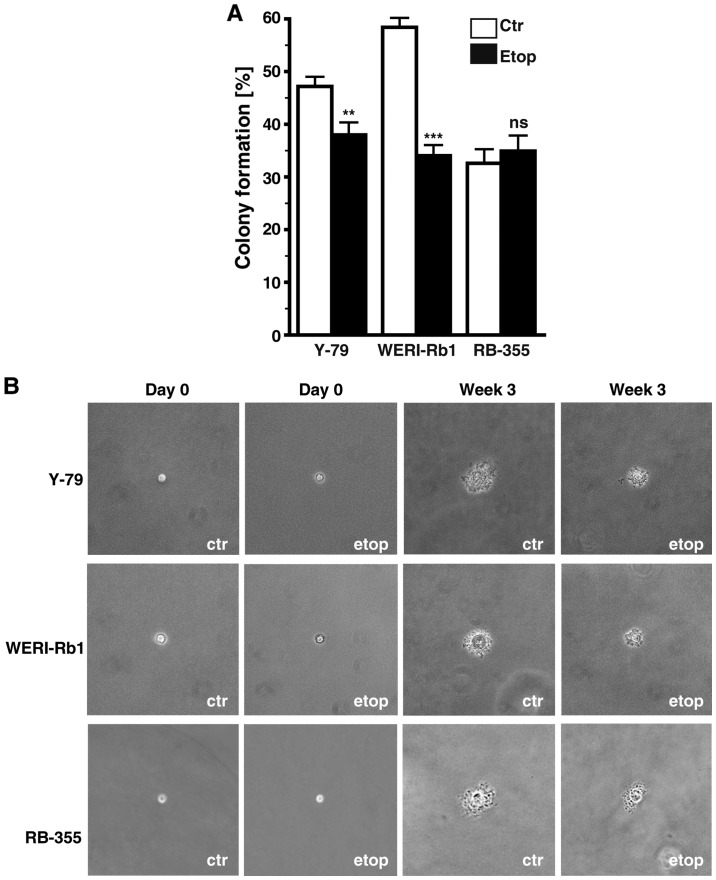
Figure 7.
Effect of etoposide resistance on RB cell colony formation capacity. (A) Quantification of soft agarose assays showing a significant lower capacity of etoposide-resistant RB cell lines to form colonies. (B) Images captured from soft agarose colonies at the day of seeding (day 0) and after 3 weeks in culture revealing that etoposide-resistant (Etop) RB cells formed considerably smaller colonies than control cells (Ctr). Values are means from 3 independent experiments ± SEM; **P<0.01 compared to the control group calculated by Student's t-test, ***P<0.001.

