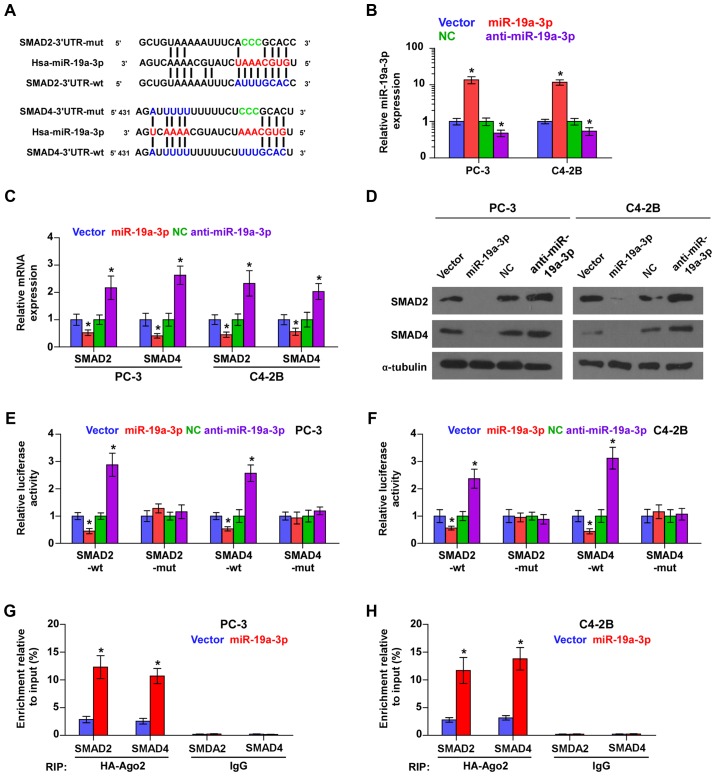
Figure 2.
SAMD2 and SMAD4 are direct targets of miR-19a-3p in PCa cells. (A) Predicted miR-19a-3p targeting sequence and mutant sequences in 3′-UTRs of SMAD2 and SMAD4. (B) Real-time PCR analysis of miR-19a-3p expression in the indicated cells. Transcript levels were normalized by U6 expression. *P<0.05. (C) Real-time PCR analysis of SMAD2 and SMAD4 expression in the indicated cells. Error bars represent the mean ± SD of three independent experiments. *P<0.05. (D) Western blot analysis of SMAD2 and SAMD4 expression in the indicated cells. α-tubulin served as the loading control. (E and F) Luciferase assay of the cells transfected with pmirGLO-3′-UTR reporter of SMAD2 and SMAD4 in the indicated cells. Error bars represent the mean ± SD of three independent experiments. *P<0.05. (G and H) miRNP IP assay showing the association between miR-19a-3p and SMAD2 and SAMD4 transcripts in PCa cells. Pulldown of IgG antibody served as the negative control. Error bars represent the mean ± SD of three independent experiments. *P<0.05.

