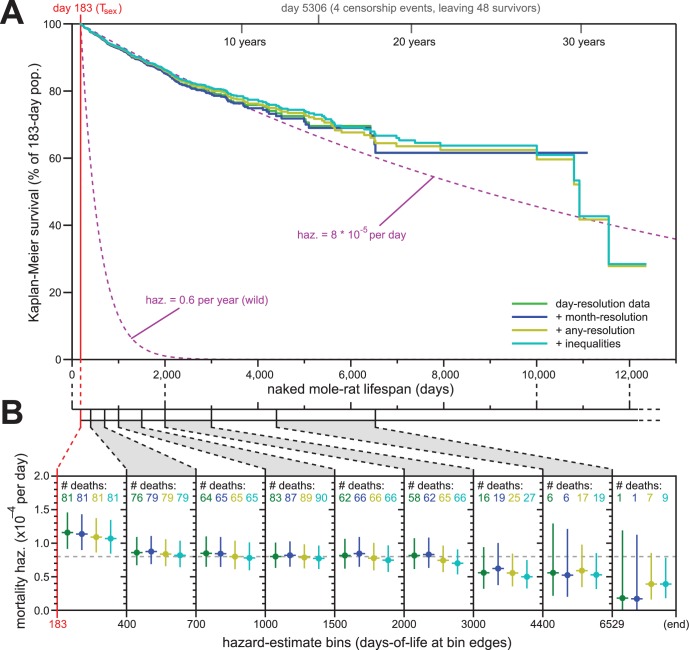
Figure 2. Addition of previously excluded, low-resolution lifespan data did not modify the apparent lifespan demographics of H. glaber.
(A) Repeated calculation of Kaplan-Meier survival, using the original data from Figure 1 (green) and iteratively adding month-resolution data (navy), less-than-month-resolution data (yellow), and inequality-derived data (cyan; see Materials and methods for further descriptions). Expected survivals from Tsex (purple) using either our consistent estimate for mortality hazard (8 * 10−5 per day) or an estimate from Hochberg (Hochberg et al., 2016) for H. glaber survival in the wild (0.6 per year). (B) Hazard estimates across each of the lifespan bins from Figure 1B, calculated for each of the expanded data sets, as described and colored in panel (A). Vertical bars indicate 95% confidence intervals. The number of observed deaths per bin is indicated at the top of each panel, colored according to the data set. Dotted grey line indicates 8 * 10−5 deaths/day.

