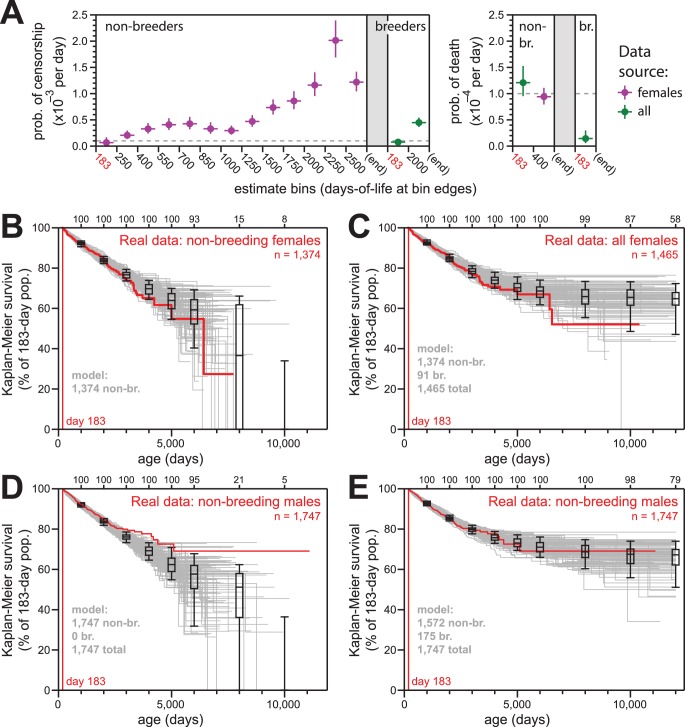
Figure 4. Simulations of naked mole-rat survival, run assuming constant mortality hazard, re-capitulated the observed data when breeders and non-breeders were appropriately balanced.
(A) The model applied here: per-day probabilities of censorship and death for non-breeders and breeders. Separate probabilities were assigned to each age bin indicated on the x-axes. Colors indicate the source data for the estimate used in the model (purple for females; green for both sexes), and error bars indicate 95% confidence intervals for the estimates used to build the model. (B) Kaplan-Meier plots for 100 simulations of populations with 1374 non-breeders (grey) versus the true plot for the 1374 non-breeding females (red). Box-and-whiskers indicate the median, quartile, and 5th/95th percentile survival values for simulated populations that had not terminated due to censorship (i.e. 0%-survival populations were included); number of included simulations is indicated along the top axis. (C) Kaplan-Meier plots for 100 simulations of populations with 1374 non-breeders and 91 breeders (grey) versus the true plot for the 1374 non-breeding and 91 breeding females (red). Box-and-whiskers as in panel (B). (D) Kaplan-Meier plots for 100 simulations of populations with 1747 non-breeders (grey) versus the true plot for the 1747 recorded-as-non-breeding males (red). Box-and-whiskers as in panel (B). (E) Kaplan-Meier plots for 100 simulations of populations with 1747 individuals, split into 1572 non-breeders and 175 breeders (grey) versus the true plot for the 1747 recorded-as-non-breeding males (red). Box-and-whiskers as in panel (B).

