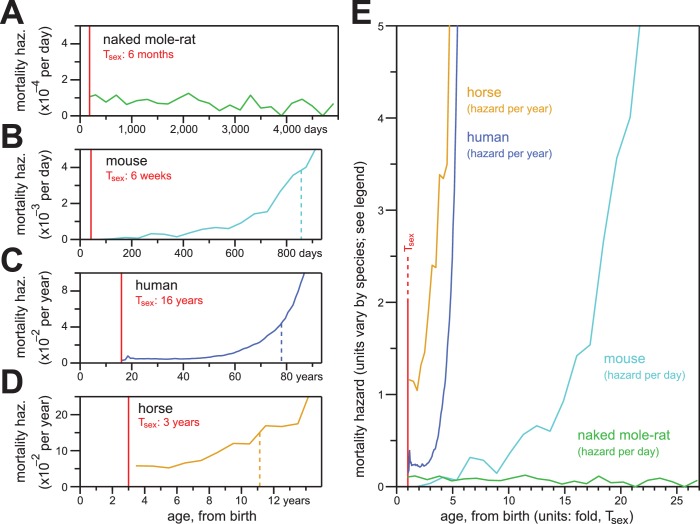
Figure 5. In contrast to the mortality hazards of other mammals, which increased with chronological age, the mortality hazard of naked mole-rats remained constant.
(A–D) Age-specific mortality hazard for naked mole-rats (A; green), calculated for 200 day intervals; for mice (B; cyan), calculated for 50 day intervals using the control-mouse survival data reported by Miller (Miller et al., 2014); for human females (C; navy), by year, as reported for the 1900 birth cohort by Bell and Miller (Bell and Miller, 2005); and for horses (D; orange), by year, calculated from life insurance tables reported by Valgren (Valgren, 1945). Calculations begin after Tsex for each species (red). (E) Hazard plots from panels A-D, re-scaled on the x-axis to the time it takes each organism to reach Tsex from birth.

