
Figure 1. Miranda is cleared from the cortex before localizing in a basal crescent in mitosis.
(A) Larval brain NBs fixed and stained as labeled at the indicated cell cycle stage. (B) Selected frames from Video 1. NB in primary cell culture expressing Baz::GFP (green) and Mira::mCherry (red) in the transition from interphase to mitosis. Arrowheads point at Mira being cleared (−8) and at basal Mira crescent (+4). (B’) Quantification of cortical Mira::mCherry signal plotting the fluorescence intensities from the apical to the basal pole computationally straightening (Kocsis et al., 1991) the cortices of five NBs against the distance in percent. Fluorescence was background subtracted and normalized to background subtracted cytoplasmic signal (1, dotted line). Cortical signal (yellow dotted line) and signal after NEB (green dotted line). Error bars, standard deviation. (C) Schematic of Mira localization. BAC{mira::mcherry-MS2} was the source of Mira::mCherry. Scale bar 10 µm. Time stamp: minutes.

Figure 1—figure supplement 1. Uniform cortical Prospero depends on Miranda in interphase larval NBs.
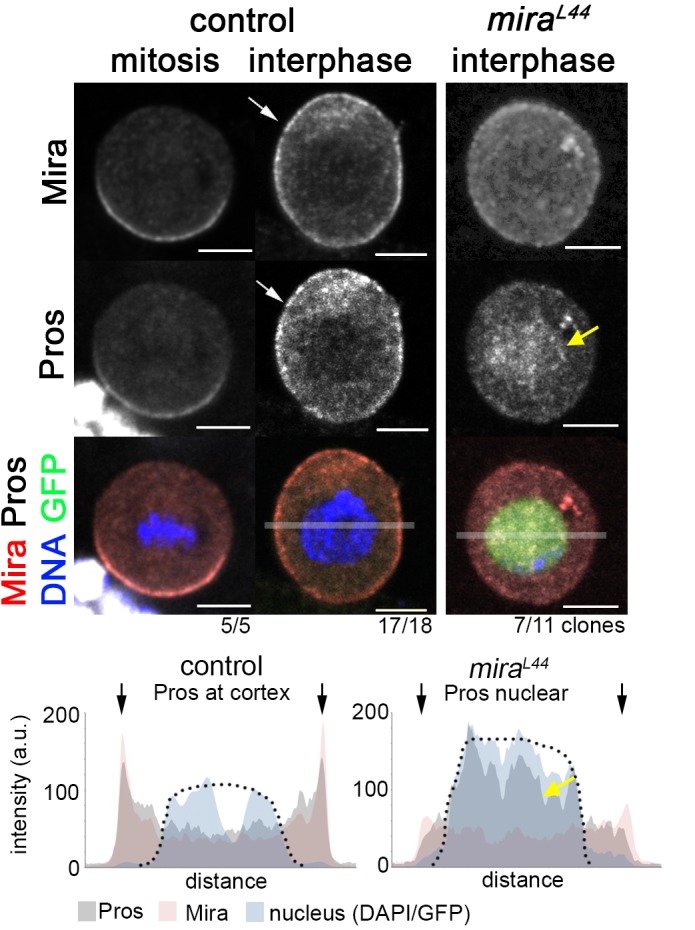
Figure 1—figure supplement 2. BAC{mira::mcherry-MS2} rescues embryonic lethality of the loss of function allele miraL44 over the deficiency DF(3R)oraI9.

Figure 1—figure supplement 3. Cortical Mira can be detected by antibody staining, in UAS-GFP-Mira overexpressing NBs and upon colcemid treatment, but not in interphase miraL44 loss of function clones.
