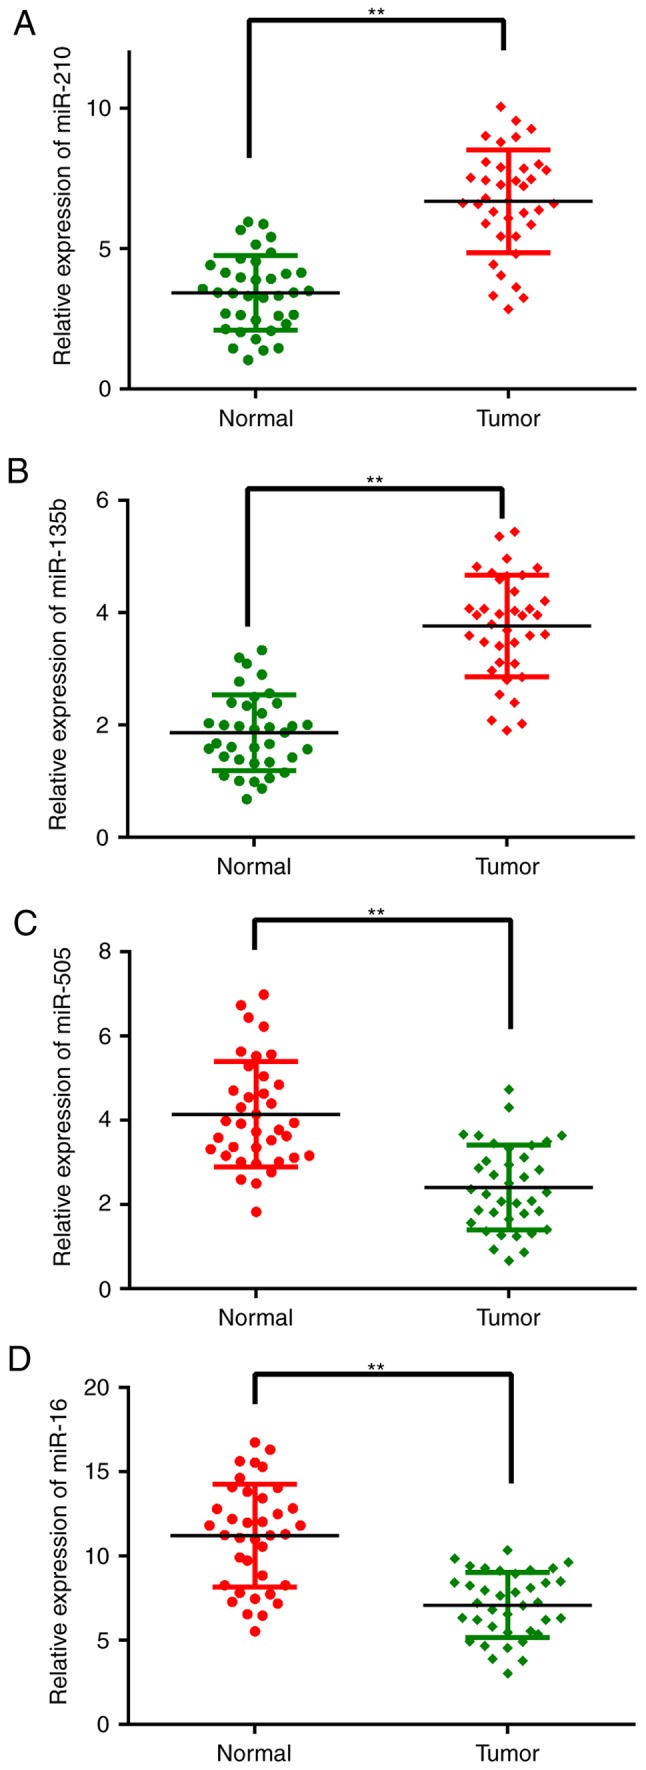
Figure 2.

Analysis of the expression levels of the 4 miRNAs in specimens using qRT-PCR. Compared with normal tissues, (C) miR-505 and (D) miR-16 showed higher expression in osteosarcoma tissues, whereas (A) miR-210 and (B) miR-135b showed lower expression. **P<0.01 vs. corresponding normal tissues.
