
Figure 3.
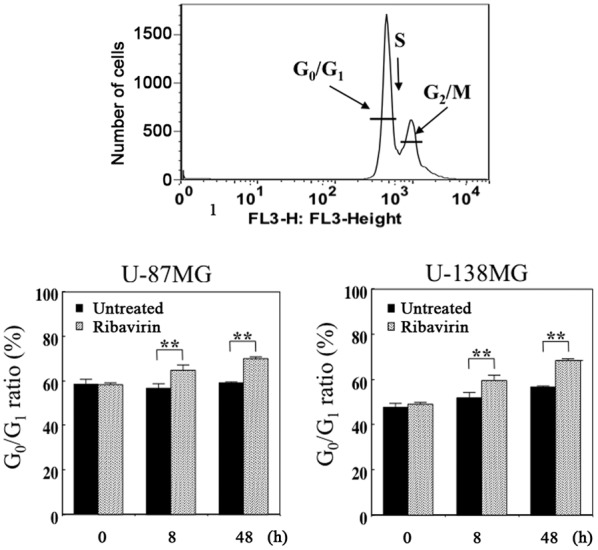
Cell cycle distribution analysis of the U-87MG and U-138MG cells which underwent treatment with ribavirin (untreated cells serving as the control) for 8 or 48 h. The histogram depicting the FACS data demonstrates an increase in the population of cells in the G0/G1 phase following ribavirin treatment, with a time-lapse, indicating that the antitumor efficacy of ribavirin resulted from the accumulation of cells in the G0/G1 phase. The results are expressed as the mean ± SE. **P<0.01 (Student's t-test).