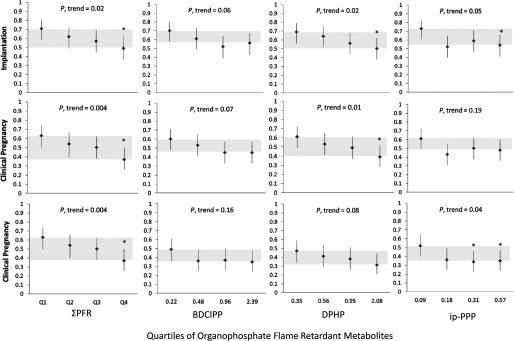
Figure 2.
Adjusted mean [95% confidence interval (CI)] proportion of cycles resulting in implantation, live birth, and clinical pregnancy by quartile of urinary organophosphate flame retardant (PFR) metabolite concentrations among 211 women undergoing 297 in vitro fertilization (IVF) cycles. Gray shading indicates change in means from the first and fourth quartile. Adjusted models control for maternal age (continuous), body mass index (BMI) (continuous), race/ethnicity (black/Asian/other, white/Caucasian), year of IVF treatment cycle (continuous), and primary Society for Assisted Reproductive Technology (SART) infertility diagnosis at study entry (female, male, unknown), with continuous variables at their mean level and categorical variables weighted by their frequency in the study population. *Significantly different from the lowest quartile (Q1) at the level.

