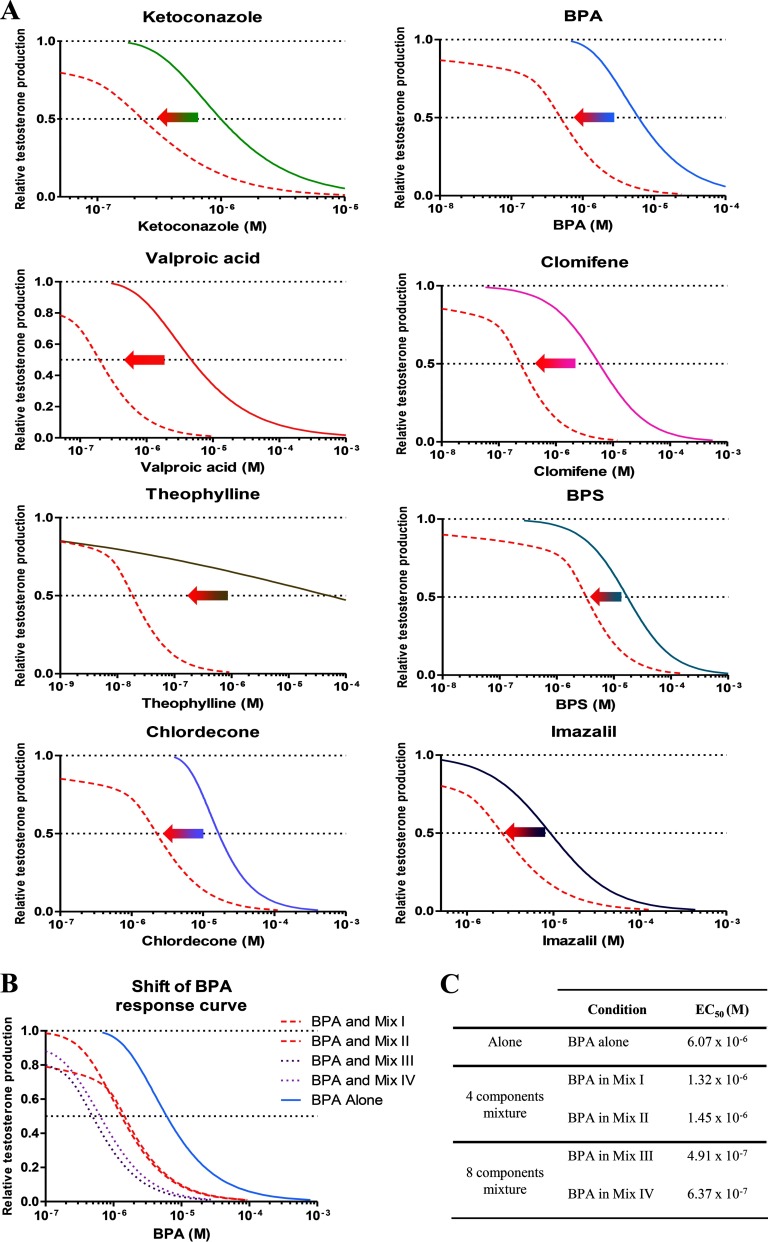
Figure 5.
The impact of co-exposures on the dose–response curves of individual mixture components. A) The concentration–response curves on the right in each panel show the responses for each compound tested on its own, and the curves on the left, the response if tested in combination with seven other compounds in mixture III (red solid lines). Testosterone production is represented as relative to the D0 production and the control level, see text for more details. B) The shift in the concentration–response curve of BPA in the presence of mixtures I–IV. C) Comparison of the concentrations of BPA associated with 50% testosterone synthesis suppression in the presence of mixtures I–IV.

