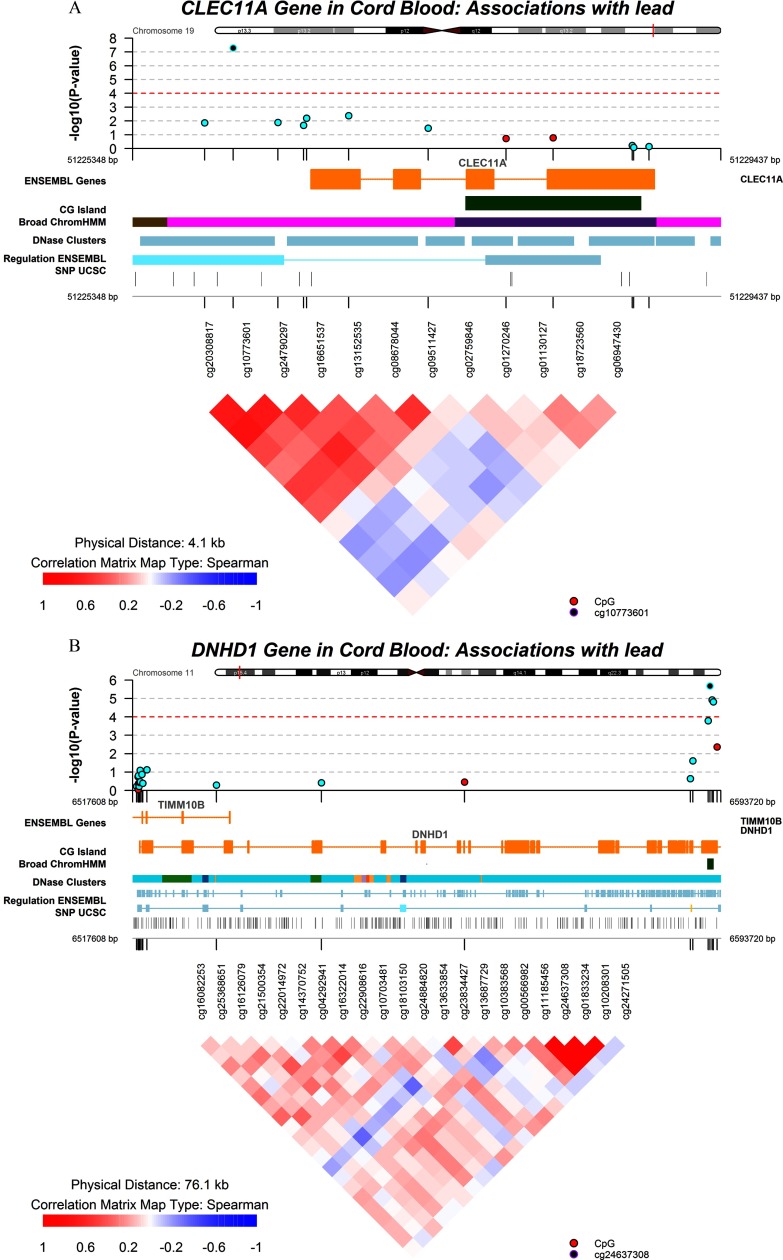
Figure 2.
Visualization of regional DNA comethylation patterns for genes CLEC11A (A) and DNHD1 (B) in umbilical cord blood among all newborns. Black dots indicate the identified key loci (cg10773601 and cg24637308), blue dots indicate CpGs in the same direction, and red dots indicate CpGs in the opposite direction associated with lead exposure.

