. 2017 Aug 21;125(8):087014. doi: 10.1289/EHP1329

Figure 3.

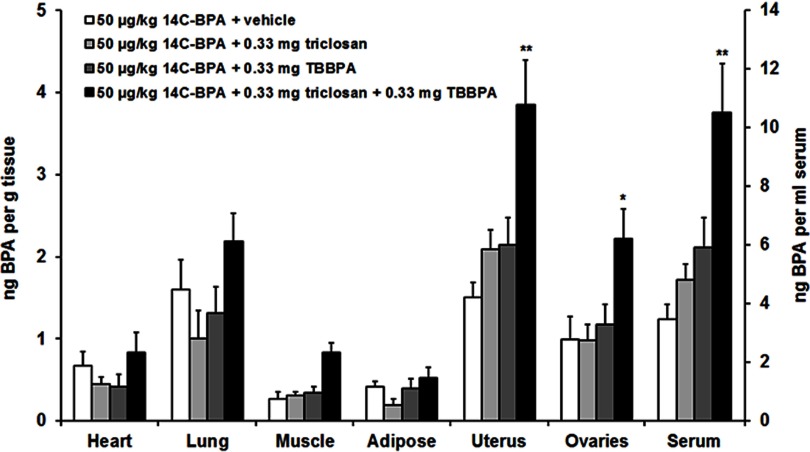
Bar graphs with standard error plotting concentrations of start superscript 14 end superscript C-BPA in nanograms BPA per gram tissue (left y-axis) and in nanograms BPA per milliliter serum (right y-axis) for heart, lung, muscle, adipose, uterus, ovaries, and serum of female mice (x-axis) for the following dietary administration groups: 50 micrograms per kilogram 14C BPA plus vehicle, 50 micrograms per kilogram 14C BPA plus 0.33 milligrams of triclosan, 50 micrograms per kilogram 14C BPA plus 0.33 milligrams of TBBPA, 50 micrograms per kilogram 14C BPA plus 0.33 milligrams of triclosan plus 0.33 milligrams of TBBPA.

Mean (+SE) concentration of 14C-bisphenol A (BPA) in the heart, lung, muscle, adipose, uterus, ovaries, and serum of diestrous females following subcutaneous (sc) injection of vehicle, 0.33mg triclosan, 0.33mg tetrabromobisphenol A (TBBPA), or 0.33mgtriclosan+0.33mgTBBPA and subsequent dietary administration of 50μg/kg 14C-BPA (n=7perdose). Difference from vehicle treatment in the same tissue: *p<0.05; **p<0.01. See Table S3 for individual animal data.