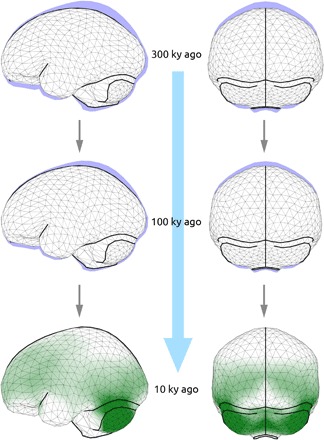
Fig. 3. Gradual evolutionary changes of endocranial shape within H. sapiens fossils shown as a series of predicted shapes according to the regression on geologic age at 300,000 years ago (top), 100,000 years ago (middle), and 10,000 years ago (bottom and blue area in top and middle).

Color coding in green (bottom) illustrates regions with surface size increase associated with this gradual shape changes. Lateral (left) and occipital (right) views (see also fig. S4 and movies S1 to S3).
