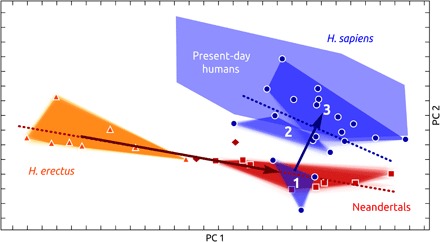
Fig. 4. bgPCA of endocranial form.

Symbols and colors as seen in Fig. 2. In addition to the evolutionary trend of shape changes in archaic and modern individuals (like in Fig. 2), allometric relationships are shown as regressions on centroid size (dotted lines) (see fig. S5 for labels of fossil individuals).
