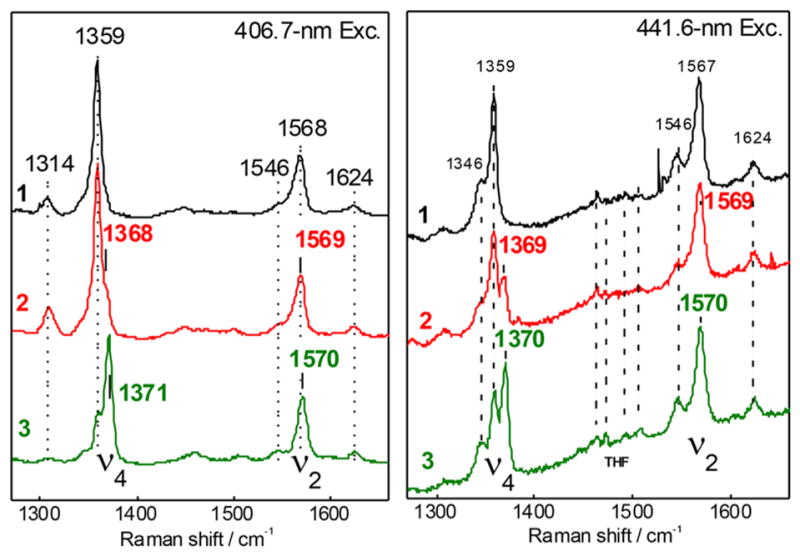
Figure 2.

rRaman spectroscopy collected at 406.7 nm (left) and 441.6 (right) nm excitation for complexes [(PIm)FeII] (1, black), [(PIm)FeIII- (O2•−)] (2, red), and [(PIm)FeIII-(−OON═O)] (3, green), showing the oxidation state marker band (ν4) and spin state marker band (ν2). Note that apparent peak maxima can vary with excitation due to differences in relative enhancement of contributing species.
