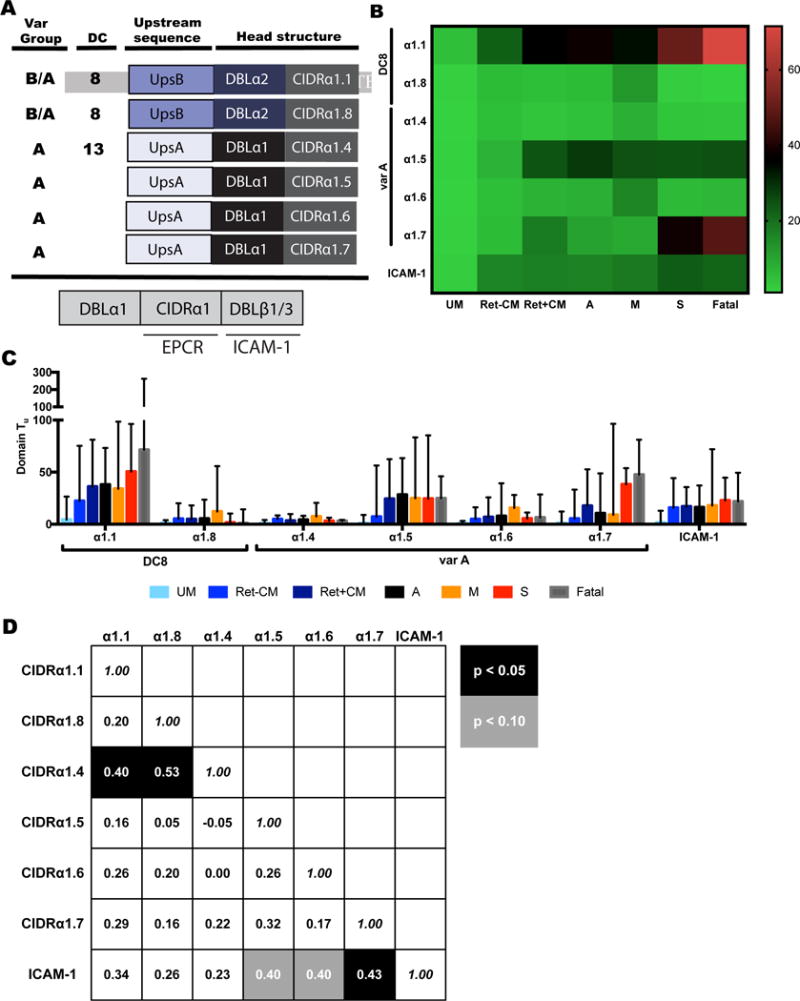
Figure 3. DC8 CIDRα1.1 and group A CIDRα1.7 EPCR-binding transcripts are enriched in CM cases with severe swelling and fatal outcomes.

(A) Schematic diagrams of EPCR-binding head structures by CIDRα1 sub-classification and the domain arrangement for dual EPCR and ICAM-1-binding (CIDRα1-DBLβ1/3) sequences.
(B) Heat map of median values of CIDRα1 subtype and ICAM-1-binding motif expression (dual EPCR and ICAM-1 binders).
(C) Bar graphs showing transcript levels of CIDRα1 subtypes and ICAM-1-binding motif. Median and IQR are indicated.
(D) Spearman correlations of transcript levels for individual EPCR-binding CIDRα1 subtypes and ICAM-1-binding motif amongst CM cases. Rho and statistical significance (correcting for multiple comparisons) are indicated.
See also Figure S2 and Tables S3–5.
