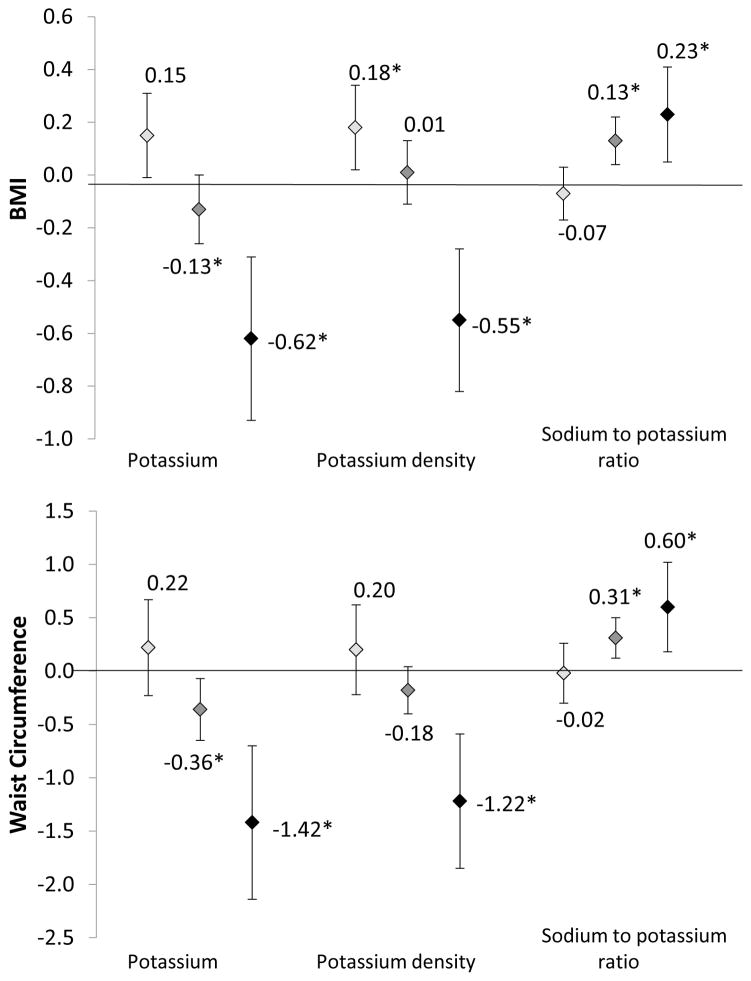
Figure 3.
Fully-adjusted associations of dietary potassium, potassium density, and sodium to potassium ratio with body mass index and waist circumference, stratified by nativity/years in the US, HCHS/SOL.
Models are adjusted for age, sex, heritage, education, income, language preference, study site, smoking, hypertension, diabetes, chronic kidney disease, alcohol use, depression, physical activity (total METs/week), and energy intake (except for in potassium density models).
We modeled 500 mg increments of potassium, 250 mg per 1000 kcal unit increments for potassium density, and 0.50 unit increments of sodium to potassium ratio (mmol/mmol)
 Foreign Born < 10 years in US
 Foreign Born 10+ years in US
◆ US born

