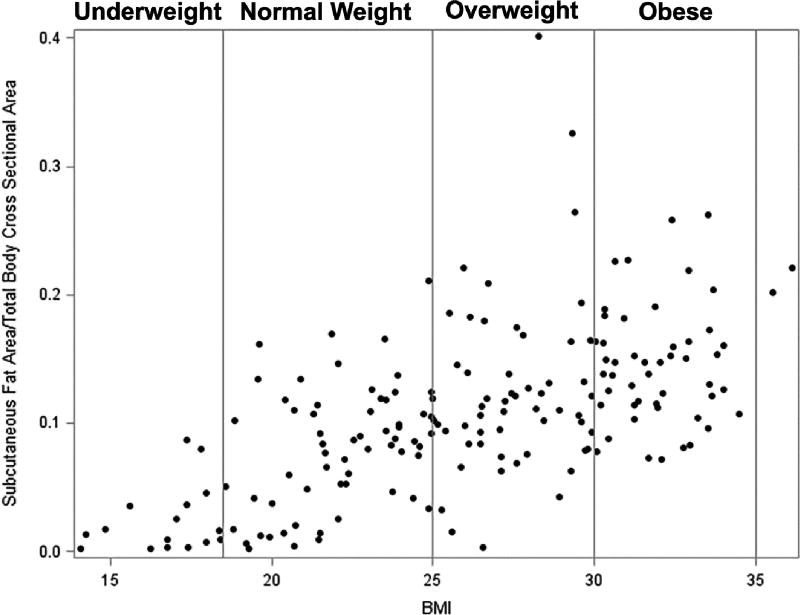
Figure 4.
Scatter plot of the relationship between subcutaneous fat area/total body cross sectional area and BMI demonstrating several patients with low subcutaneous fat/total body cross sectional area despite having a BMI in the normal range. Vertical lines mark boundaries of BMI categories: <18.5 underweight, 18.5–24.9 normal weight, 25–29.9 overweight, and >30 obese.

