
Fig 2.
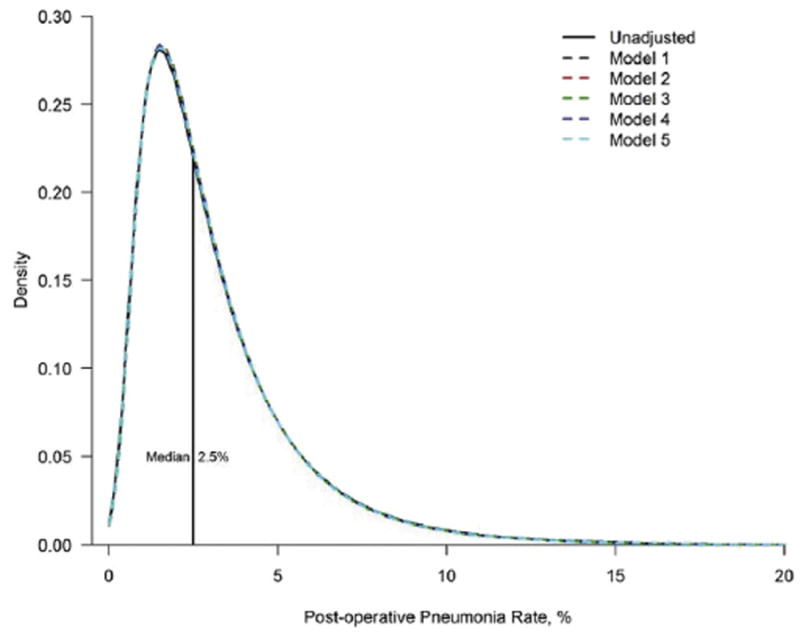
Estimated distribution of hospital-specific postoperative pneumonia rates. The area between any two points on the x-axis represents the proportion of hospitals within that range.
Official websites use .gov
A
.gov website belongs to an official
government organization in the United States.
Secure .gov websites use HTTPS
A lock (
) or https:// means you've safely
connected to the .gov website. Share sensitive
information only on official, secure websites.
Estimated distribution of hospital-specific postoperative pneumonia rates. The area between any two points on the x-axis represents the proportion of hospitals within that range.