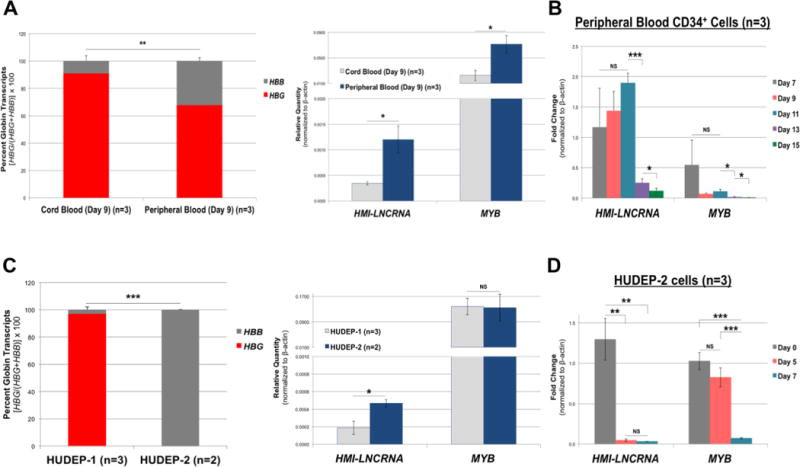
Figure 3. HMI-LNCRNA and MYB expression pattern in erythroid cells derived from cord blood and peripheral blood CD34+ mononuclear cells, and in HUDEP-1 and HUDEP-2 cells.

(A) Primary erythroid cells derived from cord blood (n=3) and adult peripheral blood (n=3) CD34+ mononuclear cells (both expanded for 7 days and differentiated for 2 days) were analyzed by qPCR analysis to determine percent HBG to HBB, and the relative quantity of MYB and HMI-LNCRNA. (B) Fold change of HMI-LNCRNA and MYB were determined during differentiation of CD34+ mononuclear cells derived from adult peripheral blood (n=3) at Days 7, 9, 11, 13 and 15. (C) Percent HBG to HBB, and the relative quantity of HMI-LNCRNA and MYB were determined by qPCR analysis in HUDEP-1 (n=3) and HUDEP-2 (n=2) cells (both maintained in expansion medium). (D) Fold change of HMI-LNCRNA and MYB were determined in HUDEP-2 cells at Days 0, 5 and 7 in cultures with differentiation medium. ACTB was used as the endogenous control. p-values: *< 0.05; **< 0.005; ***<0.0005; NS (not significant). p-values were obtained by Student T-test.
