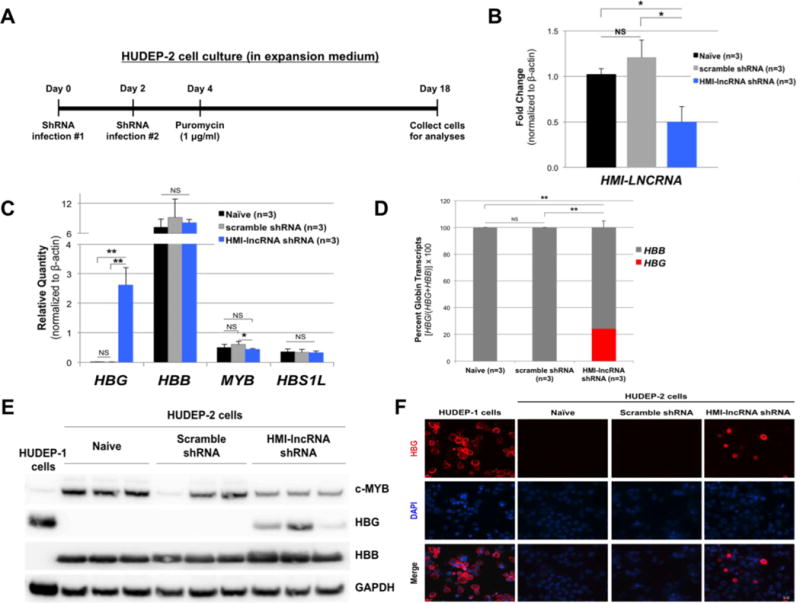
Figure 4. The effects of knocking down HMI-LNCRNA on hemoglobin, MYB and HBS1L in HUDEP-2 cells.

(A) Illustration of timeline for transduction and culture of HUDEP-2 cells. Cells were maintained in expansion medium. (B) Expression level of HMI-LNCRNA was determined by qPCR in HUDEP-2 cells that were not transduced (naïve), and transduced with either scrambled shRNA or HMI-lncRNA shRNA lentiviruses by qPCR. (C) HBG, HBB, MYB and HBS1L transcript levels, and (D) percent HBG and HBB out of the total of both transcripts were measured in these same samples. (E) Protein expression of c-MYB, HBG and HBB were analyzed by Western blot in naïve HUDEP-2 cells, and cells transduced with scrambled shRNA and HMI-lncRNA shRNA (HUDEP-1 cells were used as control). GAPDH was used as loading control. (F) Naïve HUDEP-2 cells, and cells transduced with scrambled and HMI-lncRNA shRNAs were stained with anti-HBG antibody, followed by secondary antibody labeled with Alexa Fluor-594 (in red) and DAPI to stain nuclei (in blue), and imaged with a fluorescent microscope at 40X magnification. For all qPCR analyses, ACTB was used as the endogenous control. p-values: *< 0.05; **< 0.005; ***<0.0005; NS (not significant). p-values were obtained by Student T-test.
