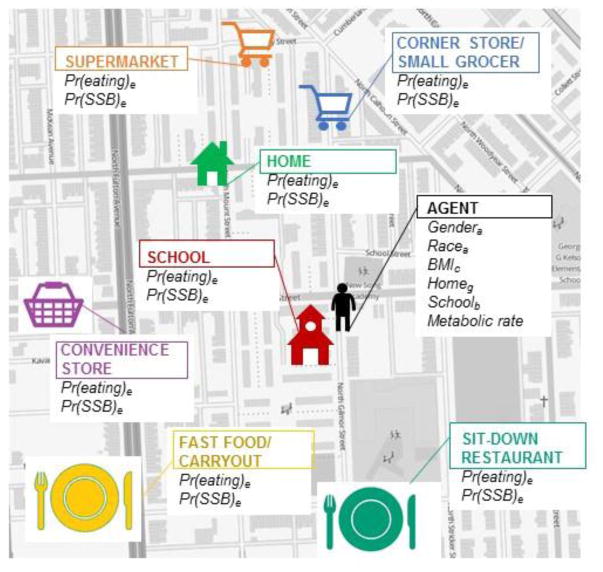
Figure 1.
Model diagram.
Notes: Illustrative representation of food store availability to agents in their environment. Pr(eating) = probability that agent eats at location type; Pr(SSB) = probability that agent consumes an SSB from location type. Letter following agent characteristics, Pr(eating) and Pr(SSB) corresponds to references for these values in Table 1.

