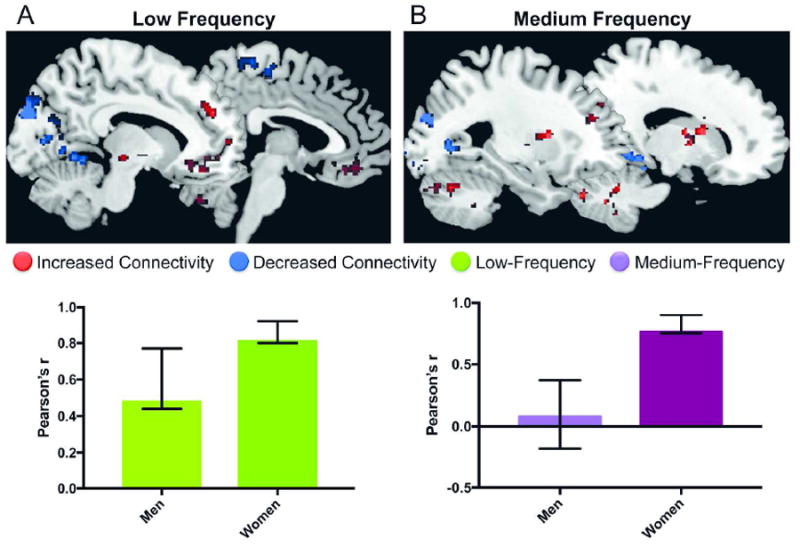
Figure 2. Whole-Brain BMI-related intrinsic activity/connectivity in men and women.

A: BMI-related slow-5 (low frequency) activity. The first latent variable in the partial lest squares analysis reflected sex similarities in the relationship between slow-5 power and BMI. However, the relationship between BMI and slow-5 power was significantly stronger in women compared to men.
Red, positive correlation between BMI and frequency power; Blue, negative correlation between BMI and frequency power
B: BMI-related slow-4 (medium frequency) activity. The first latent variable in the partial lest squares analysis reflected sex differences in the relationship between slow-4 power and BMI. The identified brain regions (top of the figure) were correlated with BMI in women but not in men. Red, positive correlation between BMI and frequency power; Blue, negative correlation between BMI and frequency power
