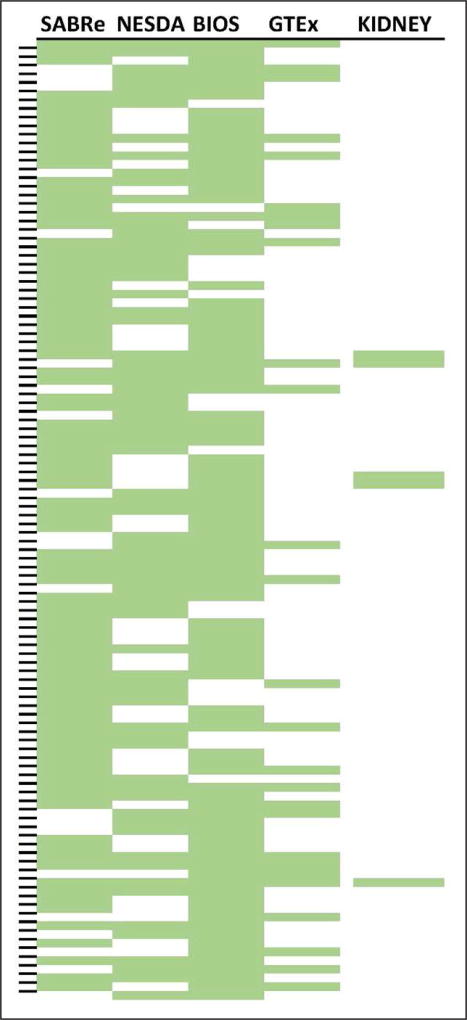
Figure.
Overlap of expression quantitative trait loci (eQTL) evidence from 4 whole-blood and 1 kidney resource. The figure indicates overlap of evidence for eQTLs from 4 whole-blood studies (SABRe, NESDA-NTR, BIOS, and GTEx) and from 1 kidney resource (TransplantLines). Every colored line indicates that this gene was analysis-wide significant in a given resource. Only genes identified by at least 2 resources are shown. The genes are sorted by genomic position on the y axis.

