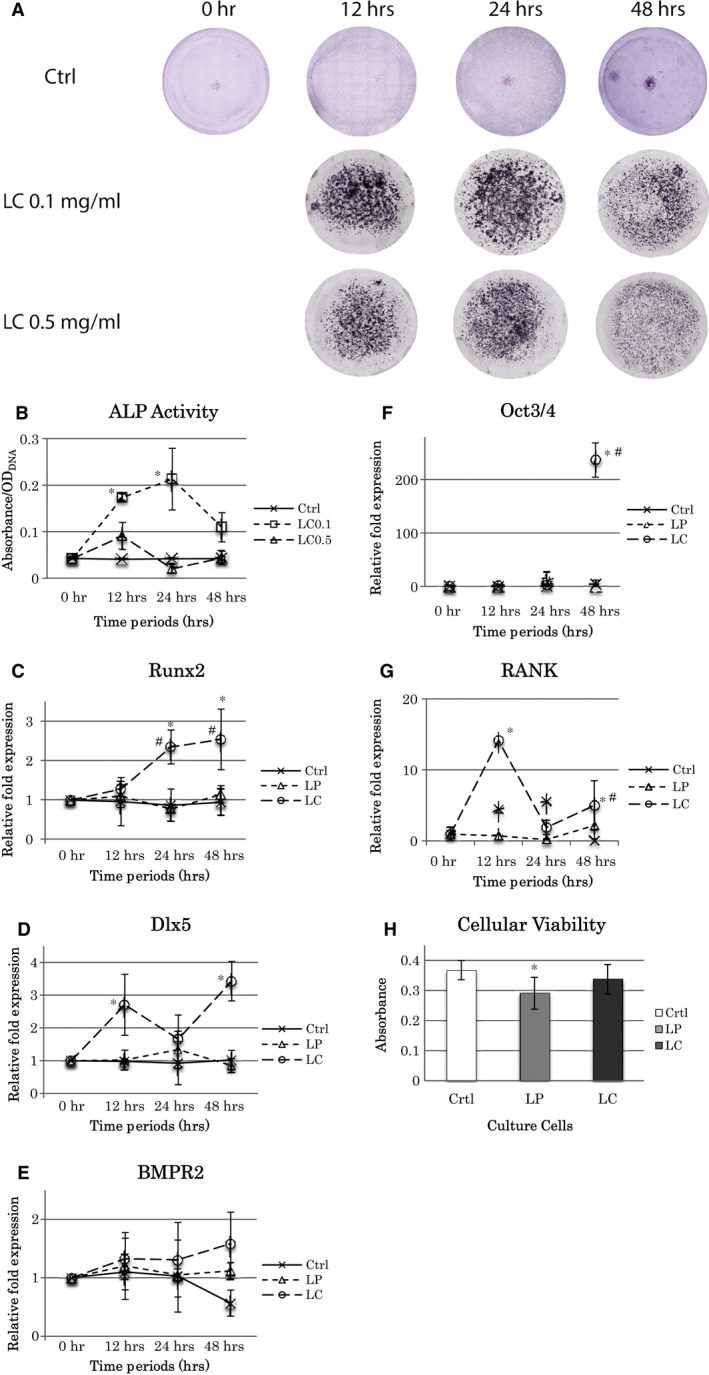
Figure 2.

Effect of liposomal clodronate (LC) concentration and treatment time on BMSC culture. Cells were cultured for 12, 24 and 48 hr with 0.1 mg/ml LC or 0.5 mg/ml LC. Liposomal PBS (LP) treatment was performed as well. Control was cultured without liposomes for 0 to 48 hr. (A) ALP staining images of BMSC with 0, 12, 24 and 48 hr of LC (0.1 or 0.5 mg/ml) treatment in cell culture. (B) ALP activity analysis. *: significantly different with both Ctrl and LC0.5 at each time point (P < 0.05). (C–G) RT‐PCR analysis. The concentration of LC and LP was 0.1 mg/ml. (C) Runx2, *: significantly different with both Ctrl and LP at each time point (P < 0.05); #: significantly different from 12 hr (P < 0.05). (D) Dlx5, *: significantly different with Ctrl and LP at each time point (P < 0.05). (E) Bmpr2, no significant difference was observed. (F) Oct3/4, *: significantly different with both Ctrl and LP (P < 0.01); #: significantly increased from earlier time points (P < 0.05). (G) RANK, *: significantly different with both Ctrl and LP at each time point (P < 0.01). #: significantly increased from 24 hr (P < 0.05). (H) Cellular viability after LP and LC at 0.1 mg/ml treatment. *: significantly different with Ctrl (P < 0.05). All the statistical data are represented as the mean ± SD by one‐way anova (n = 3).
