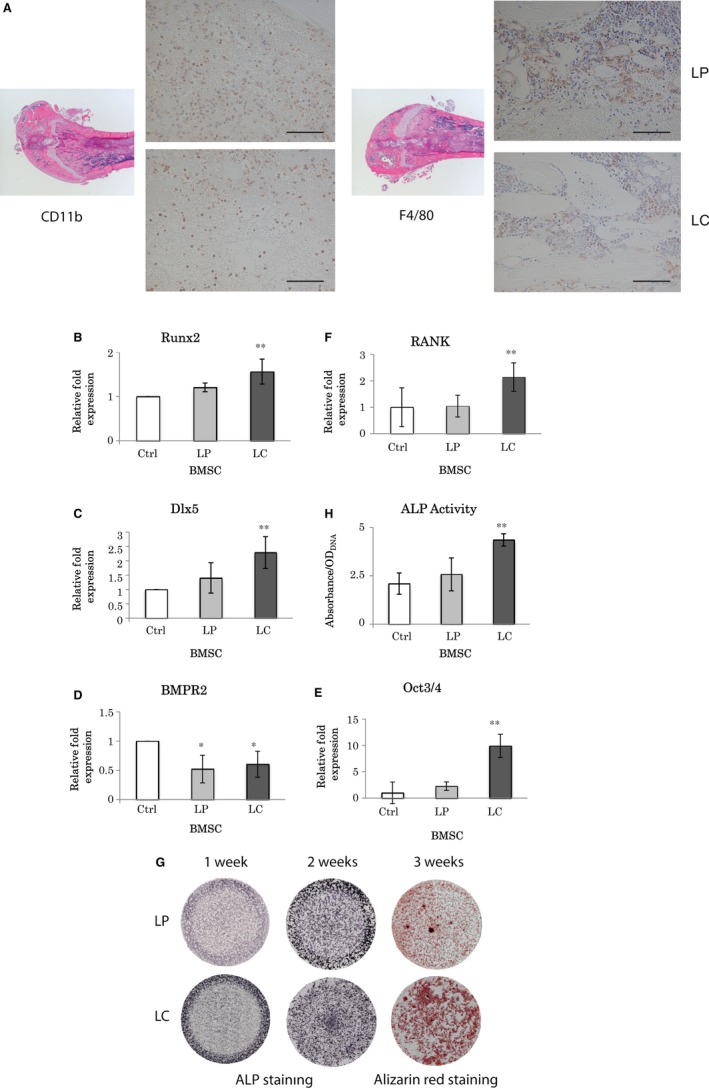
Figure 4.

Liposomal clodronate injection into mouse femur. (A) H&E staining and immunohistochemistry on mouse femur injected with LP or LC (50 μl). Immunohistochemistry detecting CD11b (monocytes) and F4/80 (macrophages) on paraffin‐embedded sections. Scale bar = 100 μm. (B–F) Real time RT‐PCR analysis on mouse BMSCs flushed out from femur 24 hr after LP and LC injection. The same volume of saline solution was injected into the femur as control. (B) Runx2 and (C) Dlx5, **: significantly different with LP (P < 0.05) and Ctrl (P < 0.01). (D) BMPR2, *: significantly different with Ctrl (P < 0.05). (E) Oct3/4, **: significantly different with Ctrl and LP (P < 0.01). (F) RANK, **: significantly different with Ctrl and LP (P < 0.05). (G) ALP and Alizarin Red staining images. ALP staining at 1 and 2 weeks, and Alizarin Red staining at 3 weeks. Comparison between LP (upper low) and LC (lower low). (H) ALP activity analysis on mouse femur BMSC 24 hr after liposomal injections. **: significantly different with LP and Ctrl (P < 0.01). All statistical data are represented as mean ± SD by one‐way anova (n = 4).
