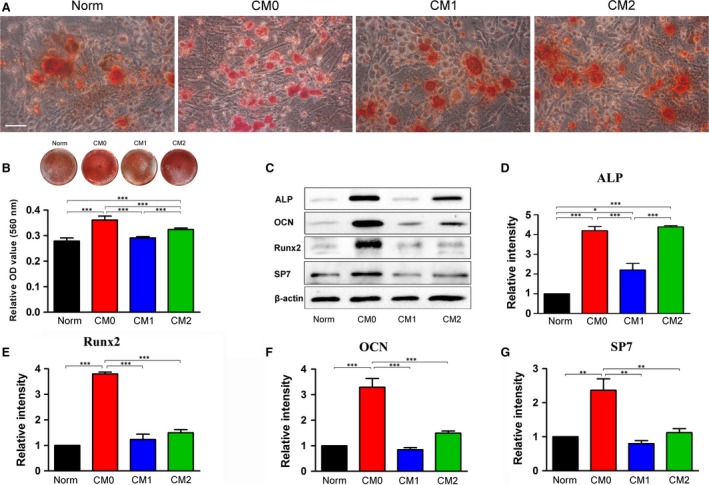
Figure 4.

Effects of CMs generated by different Mφ phenotypes on osteogenic differentiation of bone marrow mesenchymal stem cells; Norm was used as a control. (A) Representative images of mineralized nodules stained with Alizarin Red after 14 days of osteogenic induction. Scale bar: 50 μm. (B) General view of Alizarin Red staining and quantitative analysis of mineralized nodules. (C) Expression of osteogenic proteins by cells cultured in different CM‐based osteoinductive media was determined by Western blotting. Quantitative analysis of osteogenesis‐related proteins after 7 days of osteogenic induction: (D) ALP, (E) Runx2, (F) OCN and (G) SP7. The analysis was based on mean grey values and normalized to β‐actin. Data are expressed as the mean ± SD; *P < 0.05, **P < 0.01 and ***P < 0.001 represent significant differences between the indicated columns.
