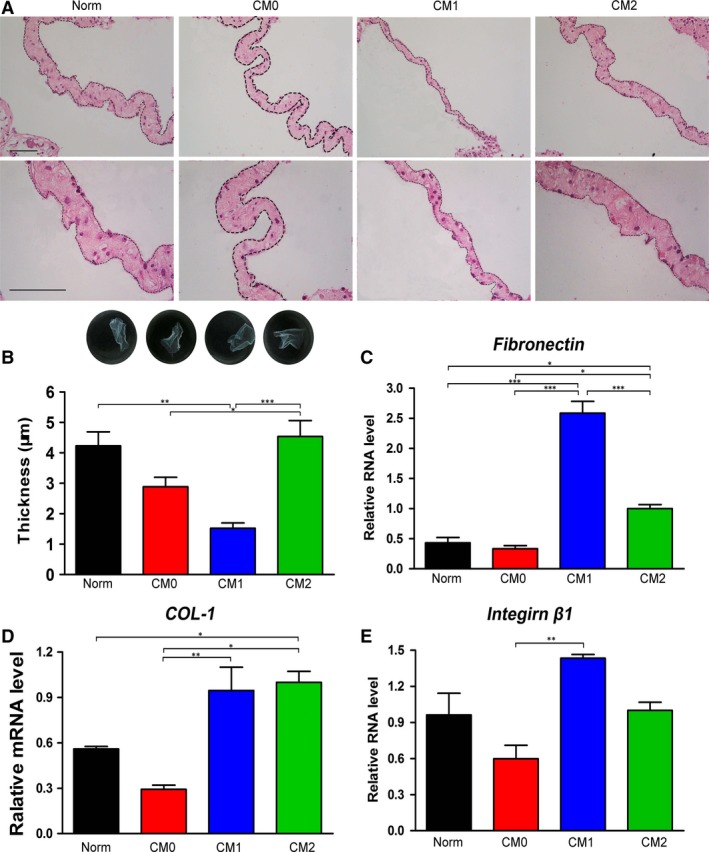
Figure 6.

Effects of CMs generated by different Mφ phenotypes on cell sheet formation by bone marrow mesenchymal stem cells; Norm was used as a control. (A) Morphologies of cell sheets observed by HE staining following 7 days of sheet induction. Scale bar: 10 μm. (B) Representative images of the obtained cell sheets (general view) and quantification of cell sheet thickness using Adobe Photoshop CS5. Relative mRNA levels of extracellular components in the cell sheets (normalized to β‐actin): (C) fibronectin, (D) COL‐1 and (E) integrin β1. Data are expressed as the mean ± SD; *P < 0.05, **P < 0.01 and ***P < 0.001 represent significant differences between the indicated columns.
