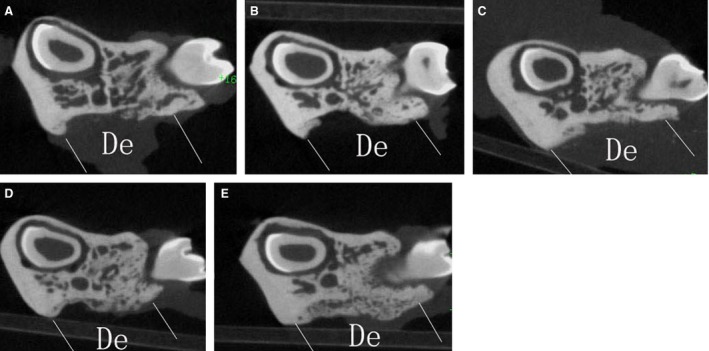
Figure 6.

Micro‐CT analysis demonstrated that the sample of the PRF + cells group showed much more newly formed hard tissue than those of the other groups at a similar layer and that of the blank group showed the least amount of new bone formation.

Micro‐CT analysis demonstrated that the sample of the PRF + cells group showed much more newly formed hard tissue than those of the other groups at a similar layer and that of the blank group showed the least amount of new bone formation.