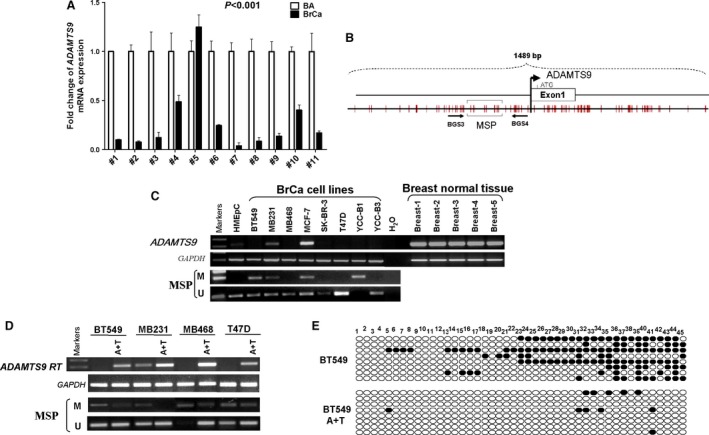
Figure 1.

The expression and methylation status of ADAMTS9 in normal mammary tissues and breast cancer cell lines. (A) ADAMTS9 expression levels in paired breast tumour tissues and surgical margin tissues were detected by qPCR. BA: breast tumour adjacent tissues; BrCa: breast cancer tissues. (B) Schematic structure of the ADAMTS9 promoter CpG island (CGI). The white rectangle represents exon 1, and the CpG sites in the CGI are indicated with short black lines. (C) Expression of ADMTS9 in breast cancer cell lines and breast normal tissues, and the methylation status of ADAMTS9 in breast cancer cell lines and HMEpC cells. (D) Pharmacological demethylation of the ADAMTS9 CGI by Aza (A) with TSA (T) induced its expression. ADAMTS9 expression before and after drug treatment was determined by RT–PCR, and demethylation was confirmed by MSP. (E) Bisulphite genomic sequencing confirmed A +T treatment could inhibit methylation of the ADAMTS9 promoter.
