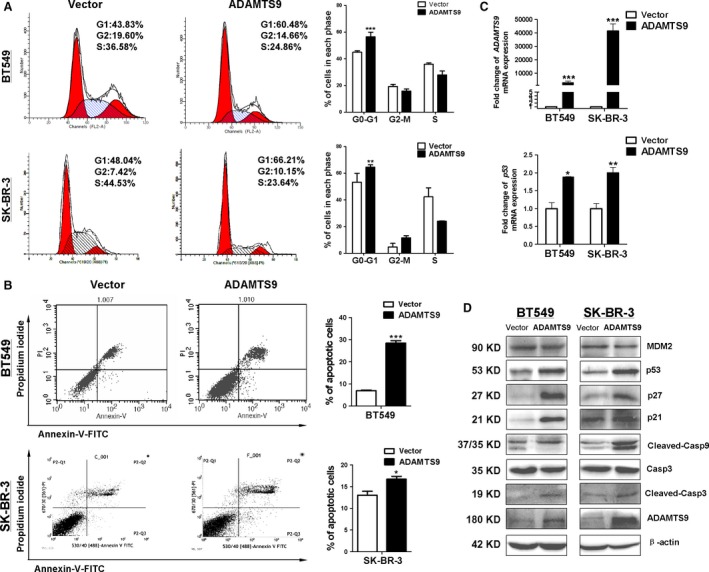
Figure 4.

ADAMTS9 induces cell cycle arrest at the G0/G1 phase and cell apoptosis in and BT549 and SK‐BR‐3 cells. (A) Effect of cell cycle distribution of vector‐ and ADAMTS9‐transfected BT549 and SK‐BR‐3 cells was detected by flow cytometry analysis. Representative flow cytometry plots (left) and histograms of cell cycle alterations (right). (B) Apoptosis of vector‐ and ADAMTS9‐transfected BT549 and SK‐BR‐3 cells was detected by Annexin V‐FITC/PI staining. Representative flow cytometry plots (left) and histograms of cell cycle alterations (right). (C) qRT‑PCR quantitatively confirmation of ectopic transcript expression of ADAMTS9 in vector‐ and ADAMTS9‐transfected BT549 and SK‐BR‐3 cells (top). And ectopic ADAMTS9 up‐regulates the expression of p53 detecting by qRT‐PCR in vector‐ and ADAMTS9‐transfected BT549 and SK‐BR‐3 cells (bottom). (D) Protein expression levels of MDM2, p53 and downstream molecules in vector‐ and ADAMTS9‐transfected BT549 and SK‐BR‐3 cells. *P < 0.05, **P < 0.01, ***P < 0.001.
